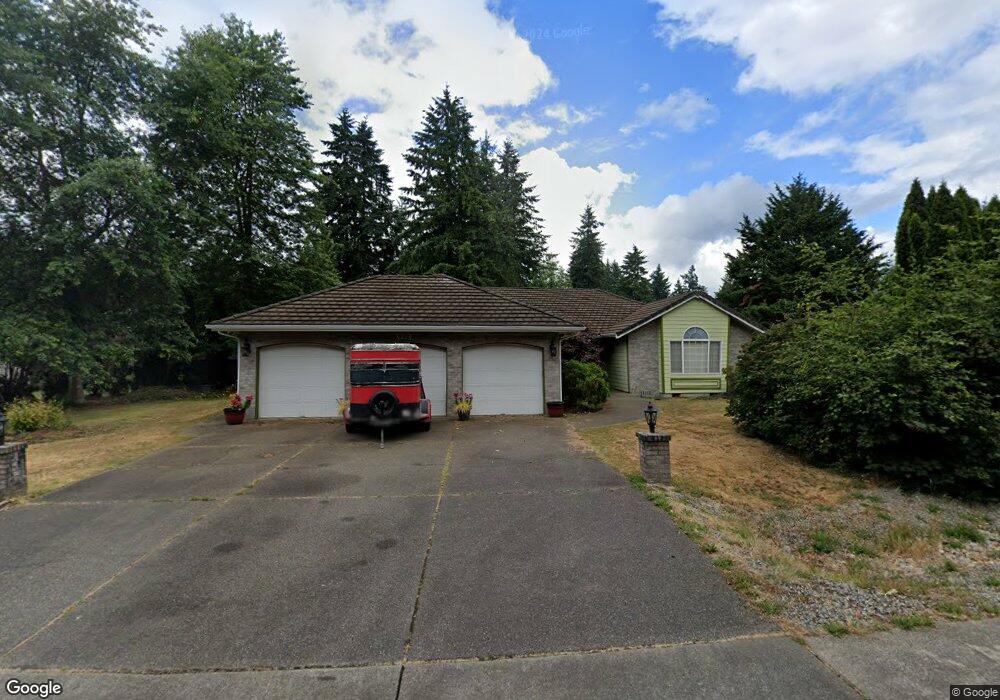
3819 Cortez Loop SW Olympia, WA 98512
Littlerock NeighborhoodEstimated Value: $619,000 - $646,310
3
Beds
2
Baths
2,068
Sq Ft
$308/Sq Ft
Est. Value
About This Home
This home is located at 3819 Cortez Loop SW, Olympia, WA 98512 and is currently estimated at $636,328, approximately $307 per square foot. 3819 Cortez Loop SW is a home located in Thurston County with nearby schools including Black Lake Elementary School, Tumwater Middle School, and A.G. West Black Hills High School.
Ownership History
Date
Name
Owned For
Owner Type
Purchase Details
Closed on
May 23, 2002
Sold by
Rush David A and Rush Janice M
Bought by
Collins Christopher R and Collins Ruth L
Current Estimated Value
Home Financials for this Owner
Home Financials are based on the most recent Mortgage that was taken out on this home.
Original Mortgage
$226,850
Interest Rate
6.89%
Purchase Details
Closed on
Jul 17, 1996
Sold by
Quality Builders Inc
Bought by
Rush David A and Rush Janice M
Home Financials for this Owner
Home Financials are based on the most recent Mortgage that was taken out on this home.
Original Mortgage
$130,000
Interest Rate
8.3%
Create a Home Valuation Report for This Property
The Home Valuation Report is an in-depth analysis detailing your home's value as well as a comparison with similar homes in the area
Home Values in the Area
Average Home Value in this Area
Purchase History
| Date | Buyer | Sale Price | Title Company |
|---|---|---|---|
| Collins Christopher R | $238,825 | Transnation Title Insurance | |
| Rush David A | $212,000 | Thurston County Title Co |
Source: Public Records
Mortgage History
| Date | Status | Borrower | Loan Amount |
|---|---|---|---|
| Previous Owner | Collins Christopher R | $226,850 | |
| Previous Owner | Rush David A | $130,000 |
Source: Public Records
Tax History Compared to Growth
Tax History
| Year | Tax Paid | Tax Assessment Tax Assessment Total Assessment is a certain percentage of the fair market value that is determined by local assessors to be the total taxable value of land and additions on the property. | Land | Improvement |
|---|---|---|---|---|
| 2024 | $5,871 | $591,800 | $250,700 | $341,100 |
| 2023 | $5,871 | $586,700 | $222,500 | $364,200 |
| 2022 | $6,068 | $571,500 | $174,100 | $397,400 |
| 2021 | $5,286 | $506,800 | $178,300 | $328,500 |
| 2020 | $5,227 | $403,300 | $153,700 | $249,600 |
| 2019 | $4,693 | $387,100 | $114,000 | $273,100 |
| 2018 | $4,661 | $353,100 | $119,200 | $233,900 |
| 2017 | $5,062 | $376,700 | $114,700 | $262,000 |
| 2016 | $4,846 | $353,900 | $117,900 | $236,000 |
| 2014 | -- | $347,200 | $117,900 | $229,300 |
Source: Public Records
Map
Nearby Homes
- 3244 66th Ave SW Unit 33
- 7025 Cavalier St SW
- 7026 Cavalier St SW
- 6137 Kirsop Rd SW
- 3140 66th Ave SW
- 4045 49th Ave SW Unit 55
- 4045 49th Ave SW Unit 70
- 4045 49th Ave SW Unit 7
- 4045 49th Ave SW Unit 74
- 4027 Dent Rd SW
- 3021 70th Way SW
- 7049 Rothenberg Dr SW
- 7008 Southwick Ct SW
- 7022 Lazy Ct SW
- 5647 Black Lake Blvd SW
- 3011 Bush Mountain Ct SW
- 7302 Jenner St SW Unit Lot 64
- 6109 Guerin St SW
- 7303 Mirasett St SW Unit Lot 30
- 7309 Mirasett St SW Unit Lot 31
- 3822 Cortez Loop SW
- 3817 Cortez Loop SW
- 3820 Cortez Loop SW
- 3828 Cortez Loop SW
- 6222 Lido Ct SW
- 3815 Cortez Loop SW
- 6217 Lido Ct SW
- 6218 Lido Ct SW
- 6218 Libo Ct SW
- 3836 Cortez Loop SW
- 3811 Cortez Loop SW
- 6205 Lido Ct SW
- 6206 Lido Ct SW
- 6136 Newport Ct SW
- 3809 Cortez Loop SW
- 6136 Lido Ct SW
- 6132 Newport Ct SW
- 3829 Cortez Loop SW
- 0 Fish Pond Creek Dr SW
- 6123 Lido Ct SW