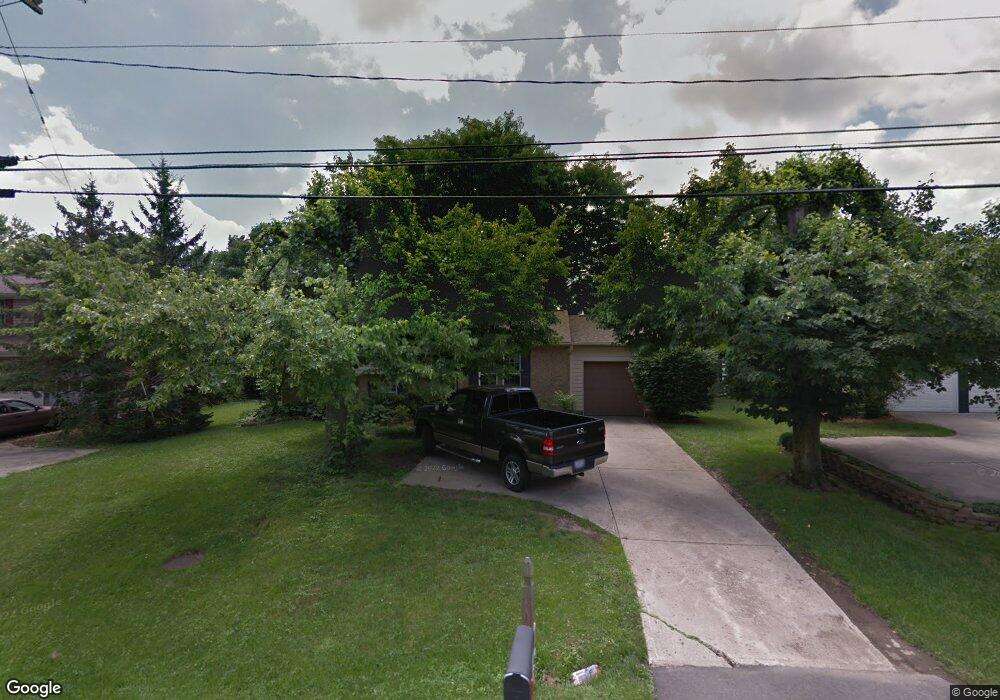
3819 Irwin Simpson Rd Mason, OH 45040
Landen NeighborhoodEstimated Value: $317,000 - $360,000
3
Beds
2
Baths
1,378
Sq Ft
$239/Sq Ft
Est. Value
About This Home
This home is located at 3819 Irwin Simpson Rd, Mason, OH 45040 and is currently estimated at $329,439, approximately $239 per square foot. 3819 Irwin Simpson Rd is a home located in Warren County with nearby schools including Kings Junior High School, Kings High School, and King Of Kings Lutheran Early Childhood Education.
Ownership History
Date
Name
Owned For
Owner Type
Purchase Details
Closed on
May 25, 2001
Sold by
Schehl Steven A
Bought by
Shrader William M and Shrader Lena L
Current Estimated Value
Home Financials for this Owner
Home Financials are based on the most recent Mortgage that was taken out on this home.
Original Mortgage
$96,000
Outstanding Balance
$34,212
Interest Rate
7.07%
Mortgage Type
New Conventional
Estimated Equity
$295,227
Purchase Details
Closed on
May 25, 1993
Sold by
Kovacs Mark and Kovacs Terri A.
Bought by
Schehl and Schehl Steven A
Purchase Details
Closed on
Sep 25, 1984
Sold by
Byers Gordon A and Byers Marcel
Bought by
Kovacs and Kovacs Mark
Purchase Details
Closed on
Aug 11, 1982
Sold by
Byers Byers and Byers Gordon A
Purchase Details
Closed on
Dec 31, 1979
Sold by
Ryland Group
Purchase Details
Closed on
Sep 19, 1979
Sold by
Landen Farm Co
Purchase Details
Closed on
Jan 19, 1978
Sold by
Landen Farm Co
Create a Home Valuation Report for This Property
The Home Valuation Report is an in-depth analysis detailing your home's value as well as a comparison with similar homes in the area
Home Values in the Area
Average Home Value in this Area
Purchase History
| Date | Buyer | Sale Price | Title Company |
|---|---|---|---|
| Shrader William M | $120,000 | -- | |
| Schehl | $94,000 | -- | |
| Kovacs | $69,000 | -- | |
| -- | -- | -- | |
| -- | $59,100 | -- | |
| -- | $63,900 | -- | |
| -- | -- | -- |
Source: Public Records
Mortgage History
| Date | Status | Borrower | Loan Amount |
|---|---|---|---|
| Open | Shrader William M | $96,000 |
Source: Public Records
Tax History
| Year | Tax Paid | Tax Assessment Tax Assessment Total Assessment is a certain percentage of the fair market value that is determined by local assessors to be the total taxable value of land and additions on the property. | Land | Improvement |
|---|---|---|---|---|
| 2025 | $4,315 | $80,840 | $24,500 | $56,340 |
| 2024 | $4,315 | $80,840 | $24,500 | $56,340 |
| 2023 | $3,740 | $62,832 | $12,915 | $49,917 |
| 2022 | $3,670 | $62,832 | $12,915 | $49,917 |
| 2021 | $3,084 | $62,832 | $12,915 | $49,917 |
| 2020 | $2,981 | $51,083 | $10,500 | $40,583 |
| 2019 | $3,016 | $51,083 | $10,500 | $40,583 |
| 2018 | $3,024 | $51,083 | $10,500 | $40,583 |
| 2017 | $3,071 | $47,467 | $10,371 | $37,097 |
| 2016 | $3,149 | $47,467 | $10,371 | $37,097 |
| 2015 | $2,837 | $47,467 | $10,371 | $37,097 |
| 2014 | $2,671 | $42,010 | $9,180 | $32,830 |
| 2013 | $2,676 | $48,070 | $10,500 | $37,570 |
Source: Public Records
Map
Nearby Homes
- 3833 Spring Mill Way
- 3761 Green Haven Way
- 8839 Pollard Place
- 3154 Vineyard Ct
- 9204 Yarmouth Dr Unit 9204
- 9547 Carriage Run Cir
- 8819 Pembrooke St
- 9626 Greenery Ct
- 4281 S Haven Dr
- 2956 Kingsley Ct
- 4390 S Mallard Cove
- 2898 Mossy Brink Ct Unit 19
- 3444 Twenty Mile Way Unit 3444
- 8846 Morley Place
- 3492 Twenty Mile Way Unit 3492
- 7838 Carraway Ct
- 4251 S Shore Dr
- 2107 Clearwater Ct
- 2113 Clearwater Ct
- 2115 Clearwater Ct
- 3807 Irwin Simpson Rd
- 3831 Irwin Simpson Rd
- 8661 Simpson Ct
- 8654 Simpson Ct
- 3795 Irwin Simpson Rd
- 3843 Irwin Simpson Rd
- 8663 Simpson Ct
- 8658 Simpson Ct
- 3861 Wagon Trail Rd
- 3783 Irwin Simpson Rd
- 8659 Simpson Ct
- 8650 Meadow Dr
- 3794 Irwin Simpson Rd
- 8664 Meadow Dr
- 3848 Irwin Simpson Rd
- 8662 Simpson Ct
- 8674 Meadow Dr
- 8660 Simpson Ct
- 3771 Irwin Simpson Rd
- 8675 Simpson Ct
Your Personal Tour Guide
Ask me questions while you tour the home.