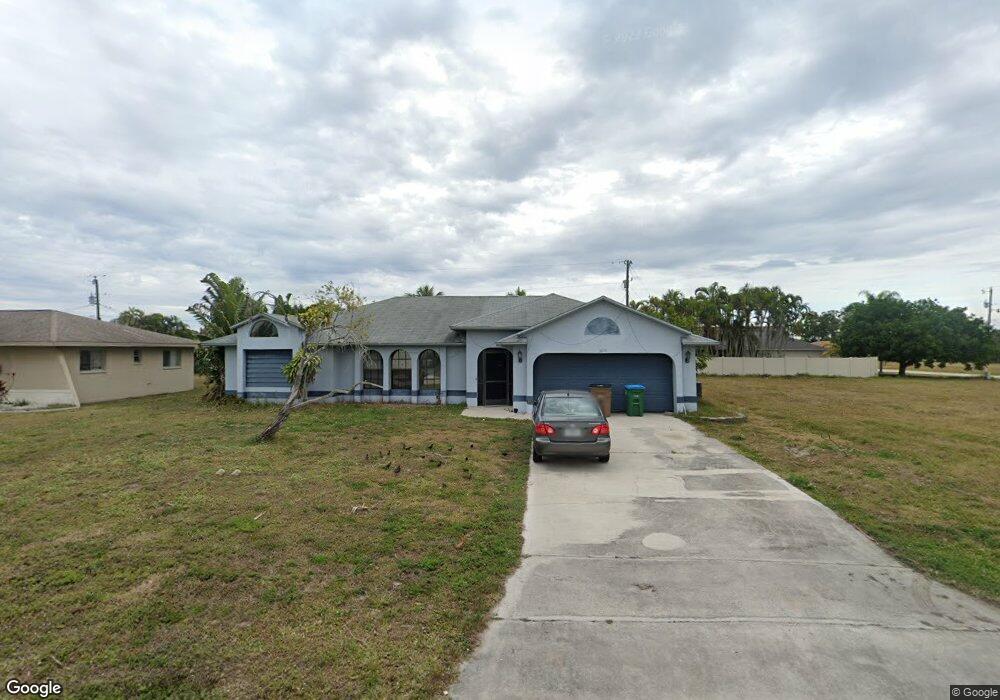
3819 SW 7th Ave Unit 3 Cape Coral, FL 33914
Pelican NeighborhoodEstimated Value: $268,000 - $295,000
3
Beds
2
Baths
1,811
Sq Ft
$156/Sq Ft
Est. Value
About This Home
This home is located at 3819 SW 7th Ave Unit 3, Cape Coral, FL 33914 and is currently estimated at $283,045, approximately $156 per square foot. 3819 SW 7th Ave Unit 3 is a home located in Lee County with nearby schools including Cape Elementary School, Caloosa Elementary School, and Tropic Isles Elementary School.
Ownership History
Date
Name
Owned For
Owner Type
Purchase Details
Closed on
Apr 13, 2022
Sold by
Vanderwey Thea J
Bought by
3819 Sw 7Th 4 Llc
Current Estimated Value
Purchase Details
Closed on
Jun 28, 2012
Sold by
Giedraitis Jonathan W
Bought by
Vanderwey Thea J
Purchase Details
Closed on
Jan 5, 2004
Sold by
Giedraitis Jonathan W
Bought by
Giedraitis Jonathan W
Home Financials for this Owner
Home Financials are based on the most recent Mortgage that was taken out on this home.
Original Mortgage
$118,000
Interest Rate
5.82%
Purchase Details
Closed on
Jun 24, 2002
Sold by
Genter Dean P and Genter Sandra A
Bought by
Giedraitis Jonathan W and Gagne Crystal
Home Financials for this Owner
Home Financials are based on the most recent Mortgage that was taken out on this home.
Original Mortgage
$91,800
Interest Rate
6.86%
Mortgage Type
Purchase Money Mortgage
Create a Home Valuation Report for This Property
The Home Valuation Report is an in-depth analysis detailing your home's value as well as a comparison with similar homes in the area
Home Values in the Area
Average Home Value in this Area
Purchase History
| Date | Buyer | Sale Price | Title Company |
|---|---|---|---|
| 3819 Sw 7Th 4 Llc | -- | Musial Law Firm Llc | |
| Vanderwey Thea J | $77,900 | Winged Foot Title Llc | |
| Giedraitis Jonathan W | -- | -- | |
| Giedraitis Jonathan W | $114,800 | -- |
Source: Public Records
Mortgage History
| Date | Status | Borrower | Loan Amount |
|---|---|---|---|
| Previous Owner | Giedraitis Jonathan W | $118,000 | |
| Previous Owner | Giedraitis Jonathan W | $91,800 |
Source: Public Records
Tax History Compared to Growth
Tax History
| Year | Tax Paid | Tax Assessment Tax Assessment Total Assessment is a certain percentage of the fair market value that is determined by local assessors to be the total taxable value of land and additions on the property. | Land | Improvement |
|---|---|---|---|---|
| 2025 | $4,834 | $228,995 | $69,445 | $159,550 |
| 2024 | $5,303 | $254,200 | $70,846 | $178,868 |
| 2023 | $5,303 | $284,489 | $50,133 | $229,875 |
| 2022 | $3,979 | $189,548 | $0 | $0 |
| 2021 | $3,561 | $172,825 | $31,450 | $141,375 |
| 2020 | $3,380 | $156,651 | $27,300 | $129,351 |
| 2019 | $3,224 | $149,383 | $27,300 | $122,083 |
| 2018 | $3,246 | $150,999 | $26,000 | $124,999 |
| 2017 | $3,065 | $140,495 | $25,000 | $115,495 |
| 2016 | $2,833 | $128,711 | $27,356 | $101,355 |
| 2015 | $2,657 | $118,196 | $17,514 | $100,682 |
| 2014 | -- | $103,201 | $13,915 | $89,286 |
| 2013 | -- | $90,697 | $6,235 | $84,462 |
Source: Public Records
Map
Nearby Homes
- 3016 SW 7th Ave
- 714 SW 39th St
- 3725 SW 7th Place
- 3726 SW 7th Place
- 3727 Skyline Blvd
- 3915 Skyline Blvd
- 3811 SW 6th Ave
- 3815 SW 6th Ave
- 1109 SW 37th St
- 3712 Skyline Blvd
- 3630 SW 6th Ave
- 714 Mohawk Pkwy
- 624 Mohawk Pkwy
- 531 Mohawk Pkwy
- 606 Mohawk Pkwy
- 3806 SW 5th Ave
- 3734 SW 8th Ct Unit 101
- 3734 SW 8th Ct Unit 103
- 4010 Skyline Blvd Unit 111
- 804 Mohawk Pkwy Unit 103
- 3815 SW 7th Ave
- 3818 SW 6th Place
- 3814 SW 6th Place
- 3822 SW 6th Place
- 3811 SW 7th Ave
- 3818 SW 7th Ave
- 3814 SW 7th Ave
- 3822 SW 7th Ave
- 3810 SW 6th Place Unit 45
- 3810 SW 7th Ave
- 3807 SW 7th Ave Unit 9
- 3807 SW 7th Ave
- 626 SW 39th St
- 630 SW 39th St
- 622 SW 39th St
- 3806 SW 6th Place
- 3819 SW 6th Place
- 3819 SW 7th Place
- 3806 SW 7th Ave
- 704 SW 39th St