Estimated Value: $526,000 - $590,968
--
Bed
--
Bath
1,761
Sq Ft
$323/Sq Ft
Est. Value
About This Home
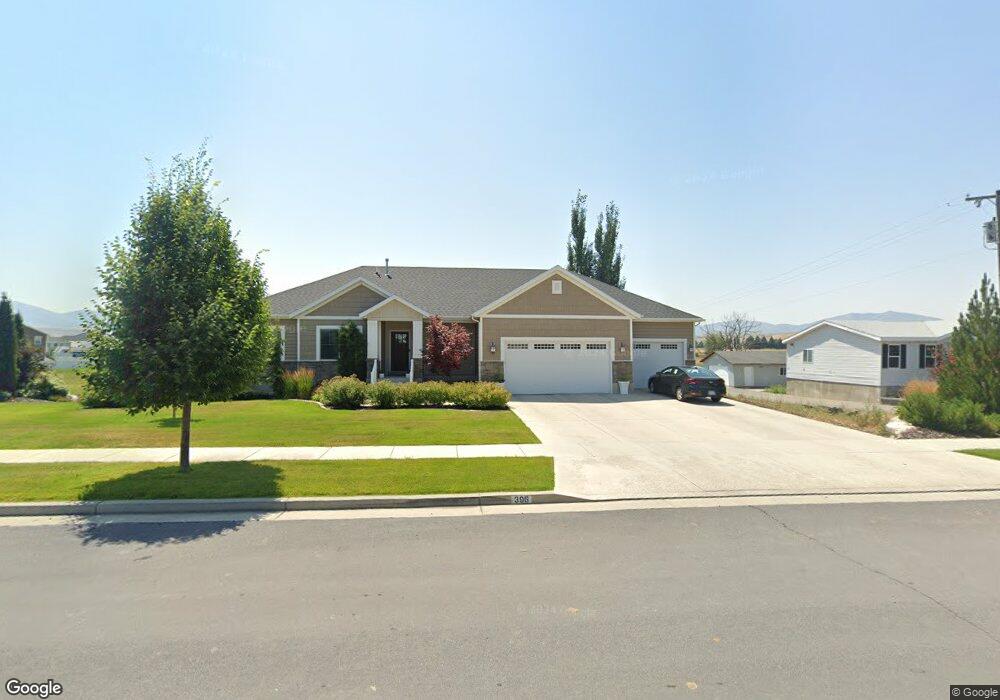
This home is located at 382 E 400 S, Hyrum, UT 84319 and is currently estimated at $568,492, approximately $322 per square foot. 382 E 400 S is a home with nearby schools including Canyon School, South Cache Middle School, and Mountain Crest High School.
Ownership History
Date
Name
Owned For
Owner Type
Purchase Details
Closed on
Sep 16, 2015
Sold by
Kartchner Inc
Bought by
Davis Jeffery R and Davi Amy L
Current Estimated Value
Home Financials for this Owner
Home Financials are based on the most recent Mortgage that was taken out on this home.
Original Mortgage
$297,369
Outstanding Balance
$232,840
Interest Rate
3.9%
Mortgage Type
New Conventional
Estimated Equity
$335,652
Purchase Details
Closed on
Jun 1, 2015
Sold by
Rg Development Llc
Bought by
Kartchner Inc
Home Financials for this Owner
Home Financials are based on the most recent Mortgage that was taken out on this home.
Original Mortgage
$248,800
Interest Rate
3.64%
Mortgage Type
Construction
Create a Home Valuation Report for This Property
The Home Valuation Report is an in-depth analysis detailing your home's value as well as a comparison with similar homes in the area
Home Values in the Area
Average Home Value in this Area
Purchase History
| Date | Buyer | Sale Price | Title Company |
|---|---|---|---|
| Davis Jeffery R | -- | Cache Title Logan | |
| Kartchner Inc | -- | Cache Title Logan |
Source: Public Records
Mortgage History
| Date | Status | Borrower | Loan Amount |
|---|---|---|---|
| Open | Davis Jeffery R | $297,369 | |
| Previous Owner | Kartchner Inc | $248,800 |
Source: Public Records
Tax History Compared to Growth
Tax History
| Year | Tax Paid | Tax Assessment Tax Assessment Total Assessment is a certain percentage of the fair market value that is determined by local assessors to be the total taxable value of land and additions on the property. | Land | Improvement |
|---|---|---|---|---|
| 2025 | $2,116 | $303,845 | $0 | $0 |
| 2024 | $2,270 | $304,395 | $0 | $0 |
| 2023 | $2,417 | $309,870 | $0 | $0 |
| 2022 | $2,522 | $309,870 | $0 | $0 |
| 2021 | $2,198 | $416,111 | $79,500 | $336,611 |
| 2020 | $2,095 | $372,206 | $79,500 | $292,706 |
| 2019 | $2,081 | $347,706 | $55,000 | $292,706 |
| 2018 | $1,959 | $316,345 | $55,000 | $261,345 |
| 2017 | $1,994 | $167,145 | $0 | $0 |
| 2016 | $2,039 | $163,845 | $0 | $0 |
| 2015 | $673 | $55,000 | $0 | $0 |
Source: Public Records
Map
Nearby Homes
- 532 E 300 S
- 175 E 500 S
- 565 E 100 S
- 516 S 770 E
- 651 E 20 S
- 66 W 400 S
- 28 N 100 E
- 667 E 730 N
- 8 S 650 W
- 42 the Hideout at Scare
- 7500 S 1400 W
- 676 E 1100 S
- 165 N 800 E
- 195 N 800 E
- 350 E 300 N
- Ashland Plan at Canyon Estates
- Magnolia Plan at Canyon Estates
- Richmond Plan at Canyon Estates
- 856 E 250 N
- 858 E 250 N