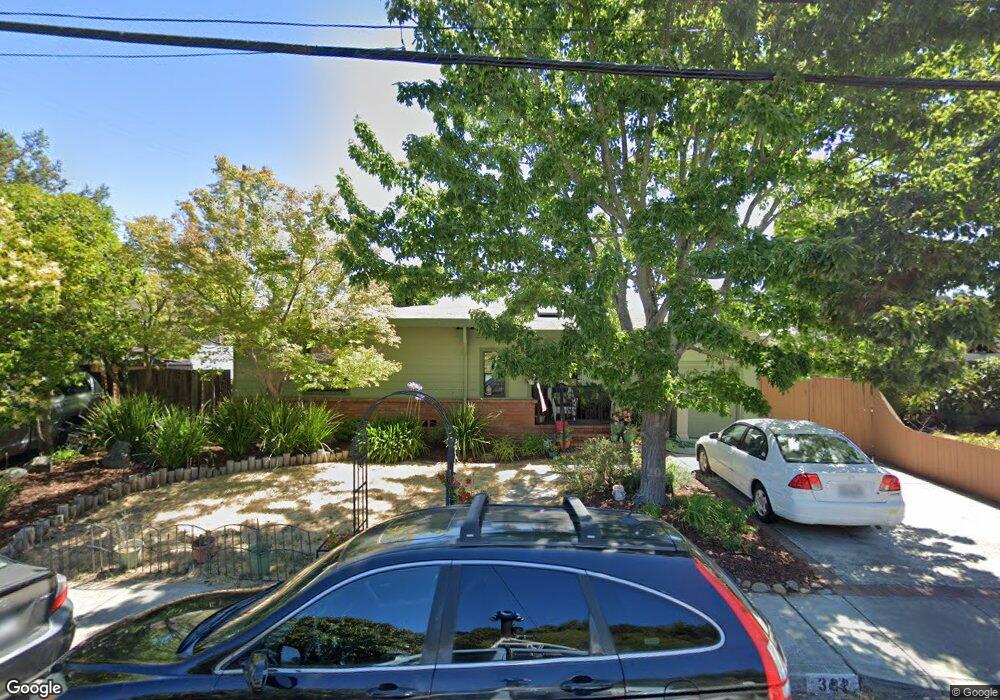
382 Irwin St San Rafael, CA 94901
Picnic Valley NeighborhoodEstimated Value: $970,417 - $1,110,000
3
Beds
1
Bath
1,254
Sq Ft
$856/Sq Ft
Est. Value
About This Home
This home is located at 382 Irwin St, San Rafael, CA 94901 and is currently estimated at $1,073,104, approximately $855 per square foot. 382 Irwin St is a home located in Marin County with nearby schools including Laurel Dell Elementary School, Coleman Elementary School, and James B. Davidson Middle School.
Ownership History
Date
Name
Owned For
Owner Type
Purchase Details
Closed on
Jun 5, 2024
Sold by
Palmer Evan D and Linnard-Palmer Luanne
Bought by
Linnard-Palmer 2024 Trust and Linnard-Palmer
Current Estimated Value
Purchase Details
Closed on
Mar 2, 1994
Sold by
Tavenner Randy L
Bought by
Palmer Evan D and Linnard Palmer Luanne
Home Financials for this Owner
Home Financials are based on the most recent Mortgage that was taken out on this home.
Original Mortgage
$181,600
Interest Rate
4.62%
Create a Home Valuation Report for This Property
The Home Valuation Report is an in-depth analysis detailing your home's value as well as a comparison with similar homes in the area
Home Values in the Area
Average Home Value in this Area
Purchase History
| Date | Buyer | Sale Price | Title Company |
|---|---|---|---|
| Linnard-Palmer 2024 Trust | -- | None Listed On Document | |
| Palmer Evan D | $526,227 | -- |
Source: Public Records
Mortgage History
| Date | Status | Borrower | Loan Amount |
|---|---|---|---|
| Previous Owner | Palmer Evan D | $181,600 |
Source: Public Records
Tax History
| Year | Tax Paid | Tax Assessment Tax Assessment Total Assessment is a certain percentage of the fair market value that is determined by local assessors to be the total taxable value of land and additions on the property. | Land | Improvement |
|---|---|---|---|---|
| 2025 | $7,189 | $413,050 | $203,946 | $209,104 |
| 2024 | $6,836 | $404,952 | $199,947 | $205,005 |
| 2023 | $6,663 | $397,012 | $196,027 | $200,985 |
| 2022 | $6,343 | $389,228 | $192,183 | $197,045 |
| 2021 | $3,121 | $381,596 | $188,415 | $193,181 |
| 2020 | $6,146 | $377,686 | $186,484 | $191,202 |
| 2019 | $5,902 | $370,281 | $182,828 | $187,453 |
| 2018 | $5,838 | $363,022 | $179,244 | $183,778 |
| 2017 | $5,635 | $355,906 | $175,730 | $180,176 |
| 2016 | $5,432 | $348,928 | $172,285 | $176,643 |
| 2015 | $5,195 | $343,688 | $169,698 | $173,990 |
| 2014 | $4,962 | $336,957 | $166,374 | $170,583 |
Source: Public Records
Map
Nearby Homes
- 355 Irwin St
- 42 Billou St
- 41 Meadow Ave
- 253 Irwin St
- 215 Bungalow Ave
- 215 Picnic Ave
- 170 Irwin St
- 742 Francisco Blvd W Unit B22
- 742 Francisco Blvd W Unit B12
- 44 Martens Blvd
- 11 San Rafael Ave
- 20 Taylor St
- 28 Marina Court Dr
- 22 Mooring Rd
- 24 Mooring Rd
- 26 Mooring Rd Unit 1
- 4 Point San Pedro Rd Unit 4
- 42 Grove St
- 60 Marina Court Dr
- 226 Bayview St
Your Personal Tour Guide
Ask me questions while you tour the home.