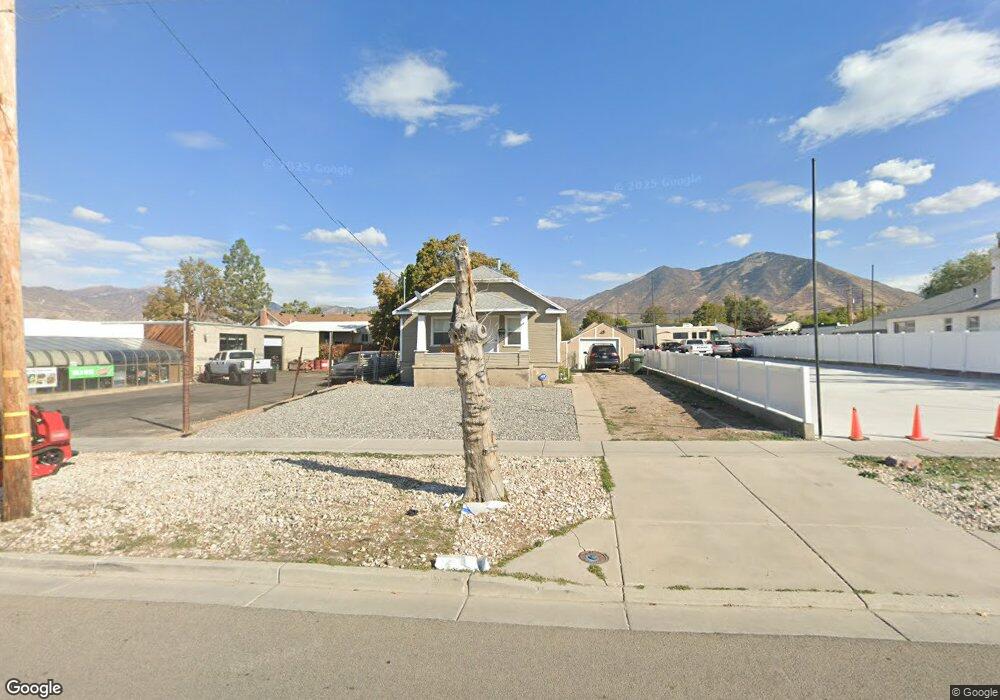
382 N Main St Tooele, UT 84074
Estimated Value: $315,000 - $326,255
2
Beds
1
Bath
1,536
Sq Ft
$208/Sq Ft
Est. Value
About This Home
This home is located at 382 N Main St, Tooele, UT 84074 and is currently estimated at $319,814, approximately $208 per square foot. 382 N Main St is a home located in Tooele County with nearby schools including Sterling Elementary School, Tooele Junior High School, and Tooele High School.
Ownership History
Date
Name
Owned For
Owner Type
Purchase Details
Closed on
Dec 13, 2018
Sold by
Motley Jacqueline
Bought by
Calton Brent
Current Estimated Value
Home Financials for this Owner
Home Financials are based on the most recent Mortgage that was taken out on this home.
Original Mortgage
$146,470
Outstanding Balance
$129,043
Interest Rate
4.8%
Mortgage Type
New Conventional
Estimated Equity
$190,771
Purchase Details
Closed on
Oct 12, 2017
Sold by
Allreo Residential Leasing Llc
Bought by
Motley Jacqueline
Home Financials for this Owner
Home Financials are based on the most recent Mortgage that was taken out on this home.
Original Mortgage
$98,700
Interest Rate
3.82%
Mortgage Type
Purchase Money Mortgage
Purchase Details
Closed on
Mar 30, 2010
Sold by
Allred J Franklin
Bought by
Allred Residentail Leasing Llc
Create a Home Valuation Report for This Property
The Home Valuation Report is an in-depth analysis detailing your home's value as well as a comparison with similar homes in the area
Purchase History
| Date | Buyer | Sale Price | Title Company |
|---|---|---|---|
| Calton Brent | -- | Old Republic Title Tooele | |
| Motley Jacqueline | -- | Inwest Title | |
| Allred Residentail Leasing Llc | -- | None Available |
Source: Public Records
Mortgage History
| Date | Status | Borrower | Loan Amount |
|---|---|---|---|
| Open | Calton Brent | $146,470 | |
| Previous Owner | Motley Jacqueline | $98,700 |
Source: Public Records
Tax History
| Year | Tax Paid | Tax Assessment Tax Assessment Total Assessment is a certain percentage of the fair market value that is determined by local assessors to be the total taxable value of land and additions on the property. | Land | Improvement |
|---|---|---|---|---|
| 2025 | $2,026 | $307,278 | $221,732 | $85,546 |
| 2024 | $2,352 | $179,554 | $127,207 | $52,347 |
| 2023 | $2,352 | $194,542 | $124,168 | $70,374 |
| 2022 | $1,883 | $162,040 | $52,381 | $109,659 |
| 2021 | $1,510 | $108,679 | $20,952 | $87,727 |
| 2020 | $1,467 | $183,099 | $38,095 | $145,004 |
| 2019 | $1,337 | $164,185 | $38,095 | $126,090 |
| 2018 | $955 | $111,190 | $47,500 | $63,690 |
| 2017 | $736 | $101,708 | $34,625 | $67,083 |
| 2016 | $640 | $51,127 | $19,044 | $32,083 |
| 2015 | $640 | $46,565 | $0 | $0 |
| 2014 | -- | $46,565 | $0 | $0 |
Source: Public Records
Map
Nearby Homes
Your Personal Tour Guide
Ask me questions while you tour the home.