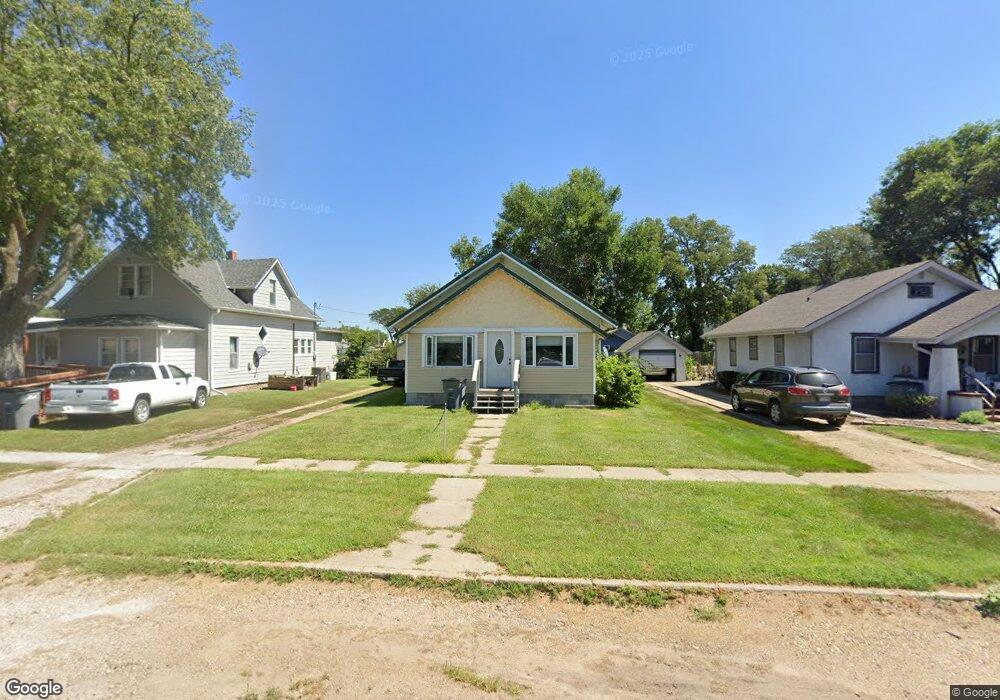
382 N Maple St Ainsworth, NE 69210
Estimated Value: $72,000 - $122,475
2
Beds
2
Baths
972
Sq Ft
$99/Sq Ft
Est. Value
About This Home
This home is located at 382 N Maple St, Ainsworth, NE 69210 and is currently estimated at $96,119, approximately $98 per square foot. 382 N Maple St is a home located in Brown County with nearby schools including Ainsworth Elementary School, Ainsworth Middle School, and Ainsworth High School.
Ownership History
Date
Name
Owned For
Owner Type
Purchase Details
Closed on
Feb 5, 2021
Sold by
Burkinshaw Stanley G and Burkinshaw Jean A
Bought by
Burkinshaw Kippy J and Burkinshaw Lisa A
Current Estimated Value
Purchase Details
Closed on
Nov 3, 2011
Sold by
Burkinshaw Scott C and Burkinshaw Jean A
Bought by
Burkinshaw Jean A and Burkinshaw Stanley G
Purchase Details
Closed on
Aug 27, 2008
Sold by
Foxworthy Mary A and Foxworthy Terry R
Bought by
Burkinshaw Scott C
Purchase Details
Closed on
Jul 15, 2008
Sold by
Mcfarland Robert Brian
Bought by
Foxworthy Mary A
Purchase Details
Closed on
Jan 15, 2008
Sold by
Mcfarland Robert Brian
Bought by
Foxworthy Mary A
Purchase Details
Closed on
May 12, 2006
Sold by
Foxworthy Mary A and Brenneman Mary A
Bought by
Mcfarland Robert Brian
Purchase Details
Closed on
Aug 16, 2002
Sold by
Brenneman Kenneth
Bought by
Brenneman Mary A
Create a Home Valuation Report for This Property
The Home Valuation Report is an in-depth analysis detailing your home's value as well as a comparison with similar homes in the area
Home Values in the Area
Average Home Value in this Area
Purchase History
| Date | Buyer | Sale Price | Title Company |
|---|---|---|---|
| Burkinshaw Kippy J | -- | None Available | |
| Burkinshaw Jean A | -- | -- | |
| Burkinshaw Jean A | -- | -- | |
| Burkinshaw Scott C | $3,000 | -- | |
| Burkinshaw Scott C | -- | -- | |
| Foxworthy Mary A | -- | -- | |
| Foxworthy Mary A | -- | -- | |
| Mcfarland Robert Brian | -- | -- | |
| Mcfarland Robert Brian | $29,500 | -- | |
| Brenneman Mary A | -- | -- |
Source: Public Records
Tax History Compared to Growth
Tax History
| Year | Tax Paid | Tax Assessment Tax Assessment Total Assessment is a certain percentage of the fair market value that is determined by local assessors to be the total taxable value of land and additions on the property. | Land | Improvement |
|---|---|---|---|---|
| 2024 | -- | $39,829 | $9,188 | $30,641 |
| 2023 | $0 | $33,105 | $5,250 | $27,855 |
| 2022 | $0 | $28,960 | $5,250 | $23,710 |
| 2021 | $463 | $28,960 | $5,250 | $23,710 |
| 2020 | $483 | $28,960 | $5,250 | $23,710 |
| 2019 | $462 | $28,407 | $5,250 | $23,157 |
| 2018 | $290 | $18,266 | $3,750 | $14,516 |
| 2017 | $291 | $16,946 | $3,750 | $13,196 |
| 2016 | $291 | $16,946 | $3,750 | $13,196 |
| 2015 | $300 | $15,890 | $3,375 | $12,515 |
| 2014 | $325 | $15,890 | $3,375 | $12,515 |
Source: Public Records
Map
Nearby Homes
- 632 N Oak St
- 135 N Elm St
- 144 W 6th St
- 86371 Nebraska 7
- 602 N Osborne St
- 1 Old Highway 7
- 409 N Wilson St
- 325 S Maple St
- 829 E 1st St
- 142 W South St
- 136 N Park St
- 0 Ainsworth Acreage Unit 11568974
- Ainsworth Unit NE 69210
- Ainsworth Unit NE 69210
- 87480 State Hwy 7 Unit Ainsworth NE 69210
- 87480 Nebraska 7
- Ainsworth Unit NE 69210
- Ainsworth Unit NE 69210
- 5.03
- Long Pine Unit NE 69217