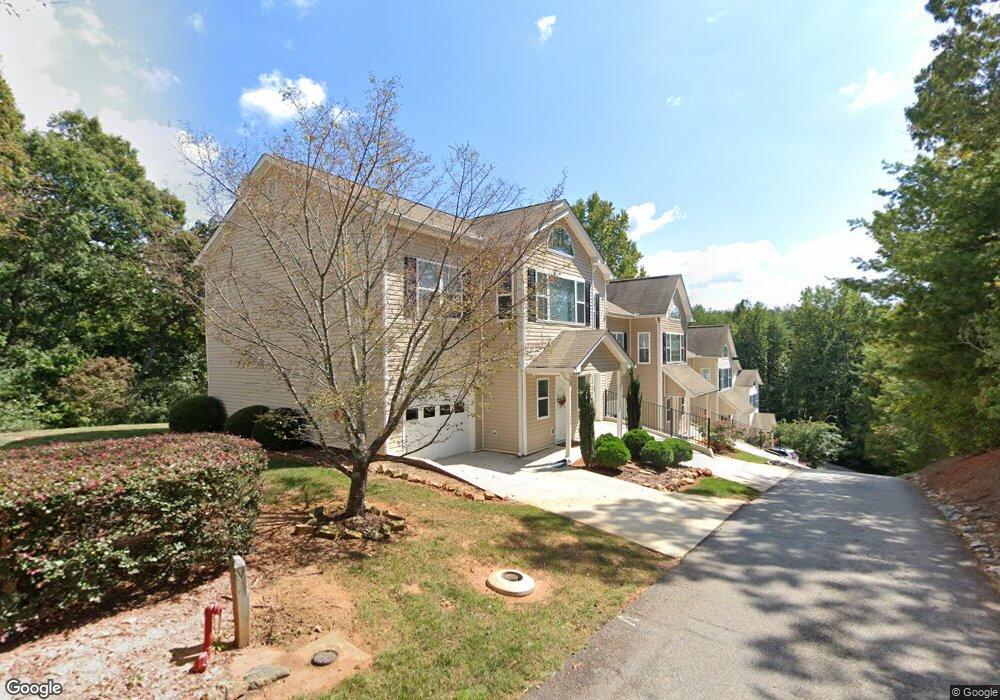
382 Pointe Cir Unit 32 Dahlonega, GA 30533
Estimated Value: $279,000 - $389,000
--
Bed
3
Baths
1,855
Sq Ft
$173/Sq Ft
Est. Value
About This Home
This home is located at 382 Pointe Cir Unit 32, Dahlonega, GA 30533 and is currently estimated at $320,080, approximately $172 per square foot. 382 Pointe Cir Unit 32 is a home located in Lumpkin County with nearby schools including Clay County Middle School and Lumpkin County High School.
Ownership History
Date
Name
Owned For
Owner Type
Purchase Details
Closed on
Jun 15, 2022
Sold by
Cooper Richard M
Bought by
White Michael John and White Terri L
Current Estimated Value
Home Financials for this Owner
Home Financials are based on the most recent Mortgage that was taken out on this home.
Original Mortgage
$201,700
Outstanding Balance
$191,885
Interest Rate
5.25%
Mortgage Type
New Conventional
Estimated Equity
$128,195
Purchase Details
Closed on
Apr 19, 2019
Sold by
Beaty Dyann W
Bought by
Cooper Richard M and Cooper Vickie M
Home Financials for this Owner
Home Financials are based on the most recent Mortgage that was taken out on this home.
Original Mortgage
$100,000
Interest Rate
4.2%
Mortgage Type
New Conventional
Purchase Details
Closed on
May 10, 2007
Sold by
Not Provided
Bought by
Beaty Dyann W
Purchase Details
Closed on
Jan 7, 2002
Bought by
Lock Inns Llc
Create a Home Valuation Report for This Property
The Home Valuation Report is an in-depth analysis detailing your home's value as well as a comparison with similar homes in the area
Home Values in the Area
Average Home Value in this Area
Purchase History
| Date | Buyer | Sale Price | Title Company |
|---|---|---|---|
| White Michael John | $269,000 | -- | |
| Cooper Richard M | $150,000 | -- | |
| Beaty Dyann W | $139,900 | -- | |
| Lock Inns Llc | -- | -- |
Source: Public Records
Mortgage History
| Date | Status | Borrower | Loan Amount |
|---|---|---|---|
| Open | White Michael John | $201,700 | |
| Previous Owner | Cooper Richard M | $100,000 |
Source: Public Records
Tax History Compared to Growth
Tax History
| Year | Tax Paid | Tax Assessment Tax Assessment Total Assessment is a certain percentage of the fair market value that is determined by local assessors to be the total taxable value of land and additions on the property. | Land | Improvement |
|---|---|---|---|---|
| 2024 | $2,661 | $112,312 | $10,000 | $102,312 |
| 2023 | $2,482 | $105,518 | $10,000 | $95,518 |
| 2022 | $2,158 | $87,161 | $6,000 | $81,161 |
| 2021 | $1,897 | $74,096 | $6,000 | $68,096 |
| 2020 | $1,583 | $63,368 | $6,000 | $57,368 |
| 2019 | $1,798 | $63,368 | $6,000 | $57,368 |
| 2018 | $1,538 | $56,224 | $6,000 | $50,224 |
| 2017 | $1,477 | $53,069 | $6,000 | $47,069 |
| 2016 | $1,408 | $49,092 | $6,000 | $43,092 |
| 2015 | $1,254 | $49,092 | $6,000 | $43,092 |
| 2014 | $1,254 | $49,566 | $6,000 | $43,566 |
| 2013 | -- | $50,039 | $6,000 | $44,039 |
Source: Public Records
Map
Nearby Homes
- 302 Pointe Cir
- 7.123 Acres Halls Mill Rd
- 00 Captain McDonald Rd
- 03 Kate Rd
- 745 Captain McDonald Rd
- 85 Summit Canyon Rd Unit H102
- 2589 Morrison Moore Pkwy E
- LOT 6 Sky Country Rd
- 00 LOT C Cavender Creek Rd
- 6480A Highway 52
- 502 Wimpy Mill Rd
- 1323 Cavender Creek Rd
- 0 Winters Mountain Rd Unit 7681054
- 0 Winters Mountain Rd Unit 10643431
- 329 Morrison Moore Pkwy E
- 300 Mountain Ridge Dr
- 159 Misty Way
- 00 Cavender Creek Rd
- 120 Riley Rd
- 382 Pointe Cir
- 376 Pointe Cir
- 402 Pointe Cir
- 370 Pointe Cir
- 408 Pointe Cir Unit BL2
- 408 Pointe Cir Unit 2D
- 408 Pointe Cir Unit 408
- 408 Pointe Cir Unit D2
- 364 Pointe Cir Unit BL3
- 414 Pointe Cir
- 420 Pointe Cir Unit BL2
- 426 Pointe Cir
- 308 Pointe Cir Unit 308
- 308 Pointe Cir Unit BL4
- 308 Pointe Cir Unit 4A
- 60 Pointe Cir
- 72 Pointe Cir
- 296 Pointe Cir
- 296 Pointe Cir Unit C4
- 66 Pointe Cir