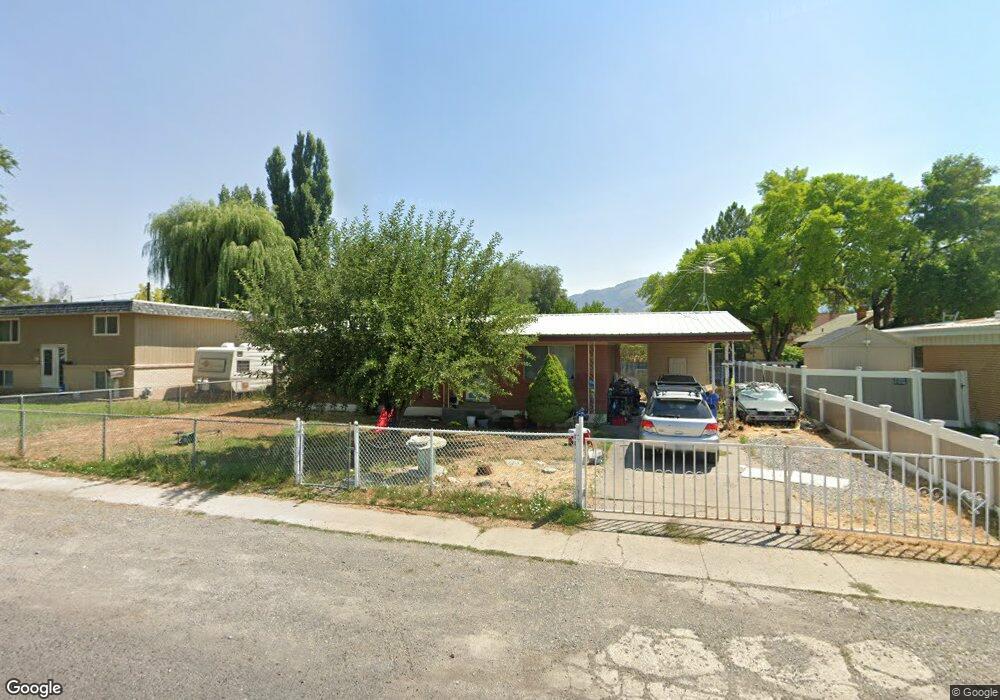
382 S 600 W Logan, UT 84321
Woodruff NeighborhoodEstimated Value: $318,000 - $351,000
3
Beds
1
Bath
1,050
Sq Ft
$318/Sq Ft
Est. Value
About This Home
This home is located at 382 S 600 W, Logan, UT 84321 and is currently estimated at $334,093, approximately $318 per square foot. 382 S 600 W is a home located in Cache County with nearby schools including Woodruff School, Mount Logan Middle School, and Logan High School.
Ownership History
Date
Name
Owned For
Owner Type
Purchase Details
Closed on
Oct 26, 2020
Sold by
Ladner Jennie
Bought by
Bounyalath Tailor M and Bounyalath Vennie T
Current Estimated Value
Home Financials for this Owner
Home Financials are based on the most recent Mortgage that was taken out on this home.
Original Mortgage
$221,906
Outstanding Balance
$195,199
Interest Rate
2.8%
Mortgage Type
FHA
Estimated Equity
$138,894
Purchase Details
Closed on
Jun 2, 2017
Sold by
Santana Refugio M and Elida Silva E
Bought by
Ladner Jennie
Home Financials for this Owner
Home Financials are based on the most recent Mortgage that was taken out on this home.
Original Mortgage
$135,800
Interest Rate
4.02%
Mortgage Type
New Conventional
Purchase Details
Closed on
Oct 20, 2005
Sold by
Santana Refugio M
Bought by
Santana Refugio M and Elida Silva E
Home Financials for this Owner
Home Financials are based on the most recent Mortgage that was taken out on this home.
Original Mortgage
$86,700
Interest Rate
5.67%
Mortgage Type
New Conventional
Create a Home Valuation Report for This Property
The Home Valuation Report is an in-depth analysis detailing your home's value as well as a comparison with similar homes in the area
Home Values in the Area
Average Home Value in this Area
Purchase History
| Date | Buyer | Sale Price | Title Company |
|---|---|---|---|
| Bounyalath Tailor M | -- | Highland Title | |
| Ladner Jennie | -- | Advanced Title Insurance | |
| Santana Refugio M | -- | Advanced Title Co | |
| Santana Refugio M | -- | American Secure Title |
Source: Public Records
Mortgage History
| Date | Status | Borrower | Loan Amount |
|---|---|---|---|
| Open | Bounyalath Tailor M | $221,906 | |
| Previous Owner | Ladner Jennie | $135,800 | |
| Previous Owner | Ladner Jennie | $3,150 | |
| Previous Owner | Santana Refugio M | $86,700 |
Source: Public Records
Tax History
| Year | Tax Paid | Tax Assessment Tax Assessment Total Assessment is a certain percentage of the fair market value that is determined by local assessors to be the total taxable value of land and additions on the property. | Land | Improvement |
|---|---|---|---|---|
| 2025 | $1,411 | $182,495 | $0 | $0 |
| 2024 | $1,450 | $181,690 | $0 | $0 |
| 2023 | $1,510 | $180,315 | $0 | $0 |
| 2022 | $1,287 | $143,465 | $0 | $0 |
| 2021 | $118 | $204,110 | $42,000 | $162,110 |
| 2020 | $1,075 | $166,700 | $42,000 | $124,700 |
| 2019 | $1,124 | $166,700 | $42,000 | $124,700 |
| 2018 | $1,117 | $151,200 | $42,000 | $109,200 |
| 2017 | $1,041 | $74,525 | $0 | $0 |
| 2016 | $1,079 | $63,800 | $0 | $0 |
| 2015 | $925 | $63,800 | $0 | $0 |
| 2014 | $836 | $63,800 | $0 | $0 |
| 2013 | -- | $60,465 | $0 | $0 |
Source: Public Records
Map
Nearby Homes
Your Personal Tour Guide
Ask me questions while you tour the home.