Estimated Value: $127,000 - $199,000
2
Beds
2
Baths
924
Sq Ft
$182/Sq Ft
Est. Value
About This Home
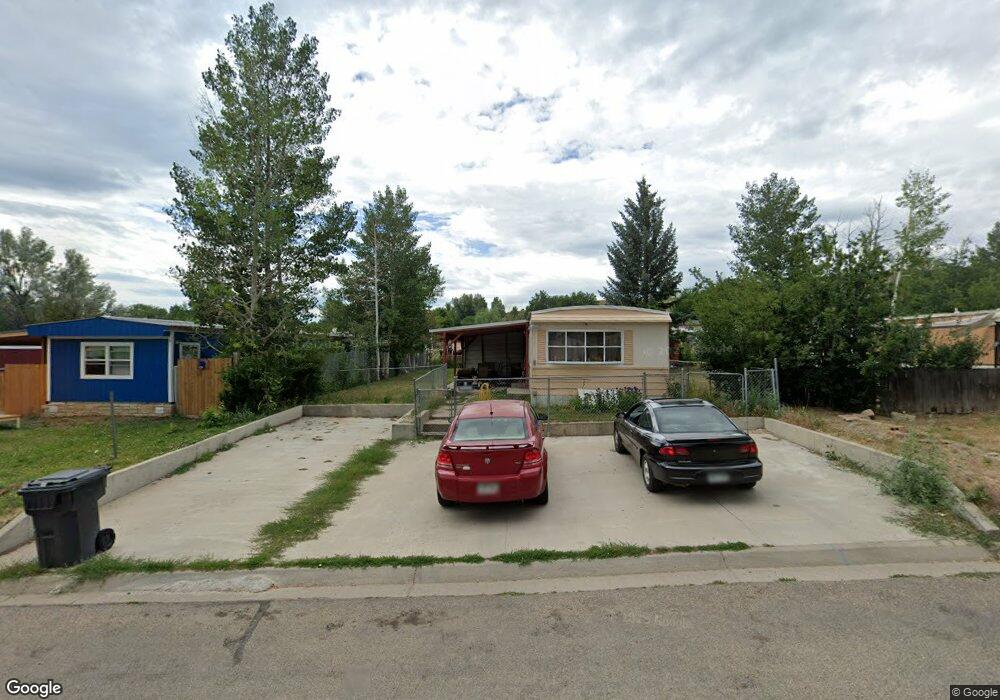
This home is located at 382 Sage Ct, Craig, CO 81625 and is currently estimated at $167,748, approximately $181 per square foot. 382 Sage Ct is a home located in Moffat County with nearby schools including Sandrock Elementary School, Moffat County High School, and Calvary Baptist School.
Ownership History
Date
Name
Owned For
Owner Type
Purchase Details
Closed on
Apr 3, 2019
Sold by
Fournier Leo R and Fournier Pamela Gaye
Bought by
Fournier Leo R
Current Estimated Value
Purchase Details
Closed on
Sep 2, 2009
Sold by
Fournier Pamela Gaye
Bought by
Fournier Leo R and Fournier Pamela Gaye
Purchase Details
Closed on
Aug 11, 2009
Sold by
Fournier Leo
Bought by
Fournier Pamela G
Purchase Details
Closed on
Apr 23, 2009
Sold by
Skidmore Steven Q
Bought by
Fournier Leo
Purchase Details
Closed on
Mar 6, 2007
Sold by
Balleck Keith Joseph
Bought by
Skidmore Steven Q
Home Financials for this Owner
Home Financials are based on the most recent Mortgage that was taken out on this home.
Original Mortgage
$60,268
Interest Rate
6.26%
Mortgage Type
VA
Create a Home Valuation Report for This Property
The Home Valuation Report is an in-depth analysis detailing your home's value as well as a comparison with similar homes in the area
Home Values in the Area
Average Home Value in this Area
Purchase History
| Date | Buyer | Sale Price | Title Company |
|---|---|---|---|
| Fournier Leo R | -- | None Available | |
| Fournier Leo R | -- | None Available | |
| Fournier Pamela G | -- | None Available | |
| Fournier Leo | $65,533 | None Available | |
| Skidmore Steven Q | $59,000 | None Available |
Source: Public Records
Mortgage History
| Date | Status | Borrower | Loan Amount |
|---|---|---|---|
| Previous Owner | Skidmore Steven Q | $60,268 |
Source: Public Records
Tax History Compared to Growth
Tax History
| Year | Tax Paid | Tax Assessment Tax Assessment Total Assessment is a certain percentage of the fair market value that is determined by local assessors to be the total taxable value of land and additions on the property. | Land | Improvement |
|---|---|---|---|---|
| 2024 | $153 | $1,760 | $0 | $0 |
| 2023 | $153 | $1,760 | $410 | $1,350 |
| 2022 | $360 | $4,270 | $1,320 | $2,950 |
| 2021 | $363 | $4,390 | $1,360 | $3,030 |
| 2020 | $324 | $3,960 | $1,360 | $2,600 |
| 2019 | $321 | $3,960 | $1,360 | $2,600 |
| 2018 | $247 | $3,040 | $1,370 | $1,670 |
| 2017 | $255 | $3,040 | $1,370 | $1,670 |
| 2016 | $279 | $3,440 | $1,510 | $1,930 |
| 2015 | $320 | $3,440 | $1,510 | $1,930 |
| 2013 | $320 | $3,890 | $1,510 | $2,380 |
Source: Public Records
Map
Nearby Homes
- 1295 Barclay St
- 1261 Taylor St
- 1159 Barclay St
- 1160 Taylor St
- 1598 Yampa Ave
- 909 Ranney St
- 900 Breeze St
- 951 Alta Vista Dr
- 866 Barclay St
- 1008 Washington St
- 1070 Lincoln St
- 885 Stout St
- 1060 Alta Vista Dr
- 1290 Alta Vista Dr
- 1155 Taylor St
- 908 Ridge Rd
- 820 Tucker St
- 772 Yampa Ave
- 353 Breeze St
- TBD Pine St Unit 34-36