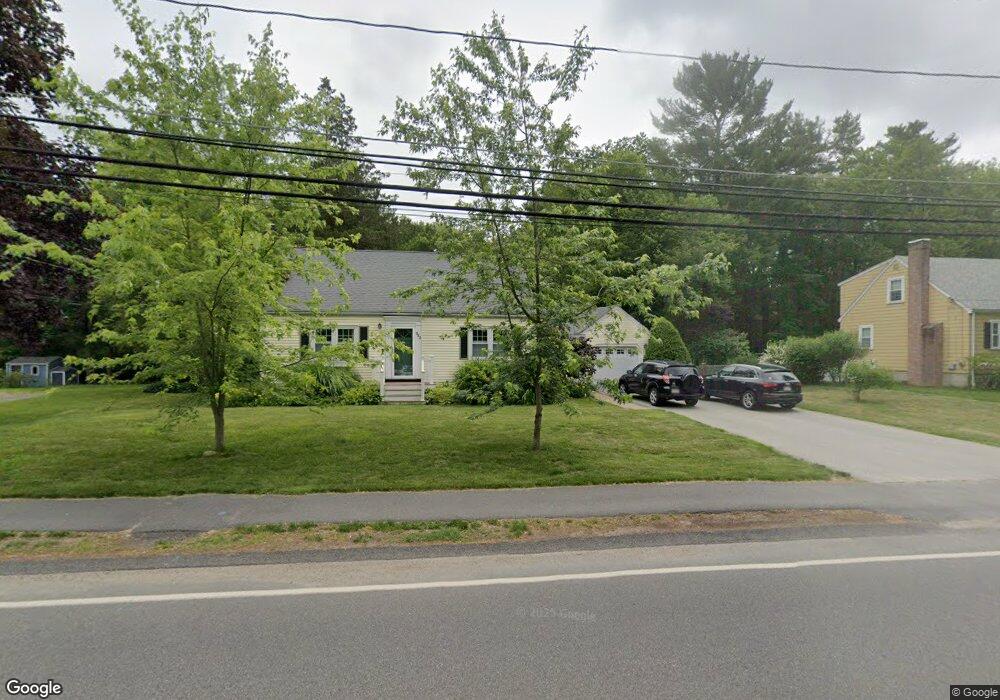
382 Stone St Walpole, MA 02081
Estimated Value: $606,000 - $734,000
3
Beds
2
Baths
1,387
Sq Ft
$484/Sq Ft
Est. Value
About This Home
This home is located at 382 Stone St, Walpole, MA 02081 and is currently estimated at $670,958, approximately $483 per square foot. 382 Stone St is a home located in Norfolk County with nearby schools including Boyden School, Eleanor N. Johnson Middle School, and Walpole High School.
Ownership History
Date
Name
Owned For
Owner Type
Purchase Details
Closed on
Jan 18, 2023
Sold by
Lincoln Brett W and Lincoln Lisa M
Bought by
W Lincoln 2023 T B
Current Estimated Value
Purchase Details
Closed on
Aug 31, 1993
Sold by
Greco John A and Greco Carol A
Bought by
Lincoln Brett W and Lincoln Lisa M
Home Financials for this Owner
Home Financials are based on the most recent Mortgage that was taken out on this home.
Original Mortgage
$146,250
Interest Rate
7.06%
Mortgage Type
Purchase Money Mortgage
Create a Home Valuation Report for This Property
The Home Valuation Report is an in-depth analysis detailing your home's value as well as a comparison with similar homes in the area
Home Values in the Area
Average Home Value in this Area
Purchase History
| Date | Buyer | Sale Price | Title Company |
|---|---|---|---|
| W Lincoln 2023 T B | -- | None Available | |
| Lincoln Brett W | $162,500 | -- |
Source: Public Records
Mortgage History
| Date | Status | Borrower | Loan Amount |
|---|---|---|---|
| Previous Owner | Lincoln Brett W | $146,250 | |
| Previous Owner | Lincoln Brett W | $120,600 |
Source: Public Records
Tax History
| Year | Tax Paid | Tax Assessment Tax Assessment Total Assessment is a certain percentage of the fair market value that is determined by local assessors to be the total taxable value of land and additions on the property. | Land | Improvement |
|---|---|---|---|---|
| 2025 | $7,825 | $609,900 | $337,500 | $272,400 |
| 2024 | $7,607 | $575,400 | $324,400 | $251,000 |
| 2023 | $7,167 | $516,000 | $282,100 | $233,900 |
| 2022 | $6,776 | $468,600 | $261,300 | $207,300 |
| 2021 | $6,389 | $430,500 | $246,500 | $184,000 |
| 2020 | $6,312 | $421,100 | $232,500 | $188,600 |
| 2019 | $6,120 | $405,300 | $223,600 | $181,700 |
| 2018 | $5,581 | $365,500 | $215,700 | $149,800 |
| 2017 | $5,393 | $351,800 | $207,400 | $144,400 |
| 2016 | $5,267 | $338,500 | $199,400 | $139,100 |
| 2015 | $5,085 | $323,900 | $190,000 | $133,900 |
| 2014 | $4,920 | $312,200 | $190,000 | $122,200 |
Source: Public Records
Map
Nearby Homes
- 37 Alice Ave
- 6 Eleanor Rd
- 587 Common St
- 635 Old Post Rd Unit 303
- 635 Old Post Rd Unit 302
- 635 Old Post Rd Unit 210
- 635 Old Post Rd Unit 2-203
- 145 South St Unit 5
- 50 Riverside Place
- 224 School St Unit 9
- 222 School St Unit 9
- 1110 Main St
- 6 Litchfields Way
- 1 Palace Ct
- 0 U S Route 1
- 881 Main St Unit 9
- 1 Providence Hwy
- 26 Drake Cir
- 1391 Main St Unit 308
- 1391 Main St Unit 306
Your Personal Tour Guide
Ask me questions while you tour the home.