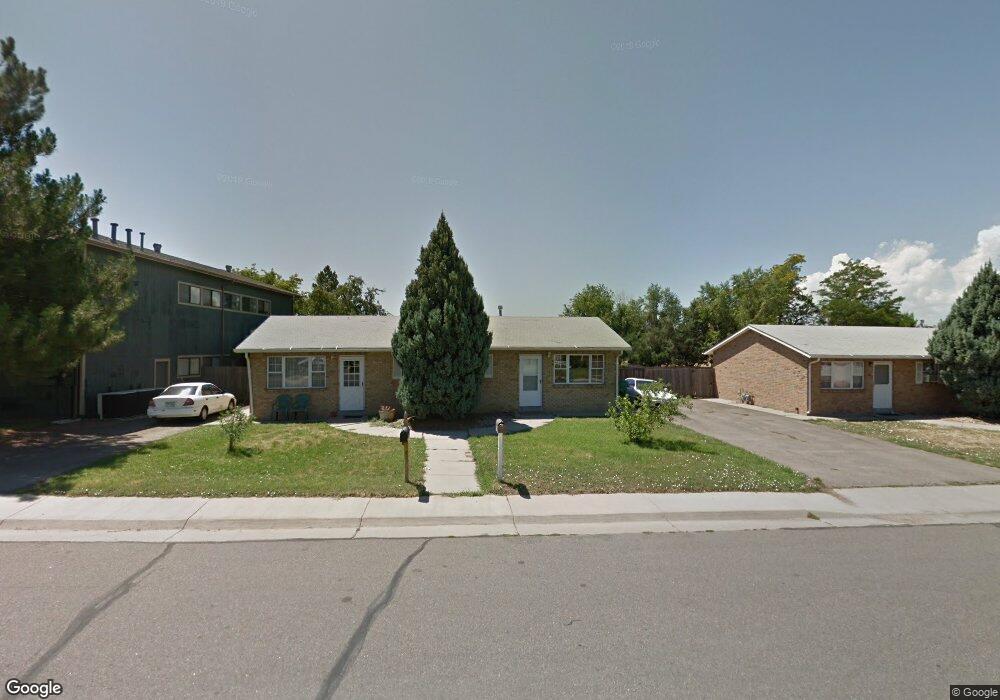
382 W Jessup St Brighton, CO 80601
Estimated Value: $369,000 - $421,000
2
Beds
2
Baths
1,225
Sq Ft
$326/Sq Ft
Est. Value
About This Home
This home is located at 382 W Jessup St, Brighton, CO 80601 and is currently estimated at $399,324, approximately $325 per square foot. 382 W Jessup St is a home located in Adams County with nearby schools including South Elementary School, Vikan Middle School, and Riverdale Ridge High School.
Ownership History
Date
Name
Owned For
Owner Type
Purchase Details
Closed on
Jun 30, 2016
Sold by
Bryan Daniel Boyce O and Bryan Lisa A O
Bought by
Valencia Joe J
Current Estimated Value
Home Financials for this Owner
Home Financials are based on the most recent Mortgage that was taken out on this home.
Original Mortgage
$163,950
Outstanding Balance
$131,218
Interest Rate
3.66%
Mortgage Type
New Conventional
Estimated Equity
$268,106
Purchase Details
Closed on
Dec 1, 2006
Sold by
Daily Philip M
Bought by
Daily Family Llc
Purchase Details
Closed on
Aug 6, 2004
Sold by
Bryan Daniel Boyce O
Bought by
Bryan Daniel Boyce O and Bryan Lisa A O
Purchase Details
Closed on
Oct 3, 2002
Sold by
Obryan Boyce P
Bought by
Obryan Boyce P and Obryan Daniel Boyce
Purchase Details
Closed on
Mar 12, 1999
Sold by
Clancy Elizabeth A and Clancy Jack E
Bought by
Obryan Boyce P
Purchase Details
Closed on
Mar 6, 1992
Create a Home Valuation Report for This Property
The Home Valuation Report is an in-depth analysis detailing your home's value as well as a comparison with similar homes in the area
Home Values in the Area
Average Home Value in this Area
Purchase History
| Date | Buyer | Sale Price | Title Company |
|---|---|---|---|
| Valencia Joe J | $218,600 | Chicago Title Co | |
| Daily Family Llc | -- | None Available | |
| Bryan Daniel Boyce O | -- | -- | |
| Obryan Boyce P | -- | -- | |
| Obryan Boyce P | $89,000 | -- | |
| -- | -- | -- |
Source: Public Records
Mortgage History
| Date | Status | Borrower | Loan Amount |
|---|---|---|---|
| Open | Valencia Joe J | $163,950 |
Source: Public Records
Tax History Compared to Growth
Tax History
| Year | Tax Paid | Tax Assessment Tax Assessment Total Assessment is a certain percentage of the fair market value that is determined by local assessors to be the total taxable value of land and additions on the property. | Land | Improvement |
|---|---|---|---|---|
| 2024 | $2,957 | $26,120 | $8,060 | $18,060 |
| 2023 | $2,943 | $30,440 | $8,120 | $22,320 |
| 2022 | $2,587 | $24,580 | $7,960 | $16,620 |
| 2021 | $2,587 | $24,580 | $7,960 | $16,620 |
| 2020 | $2,127 | $21,540 | $8,150 | $13,390 |
| 2019 | $2,129 | $21,540 | $8,150 | $13,390 |
| 2018 | $1,421 | $14,370 | $8,100 | $6,270 |
| 2017 | $1,419 | $14,370 | $8,100 | $6,270 |
| 2016 | $1,178 | $11,890 | $3,940 | $7,950 |
| 2015 | $1,176 | $11,890 | $3,940 | $7,950 |
| 2014 | -- | $9,760 | $3,220 | $6,540 |
Source: Public Records
Map
Nearby Homes