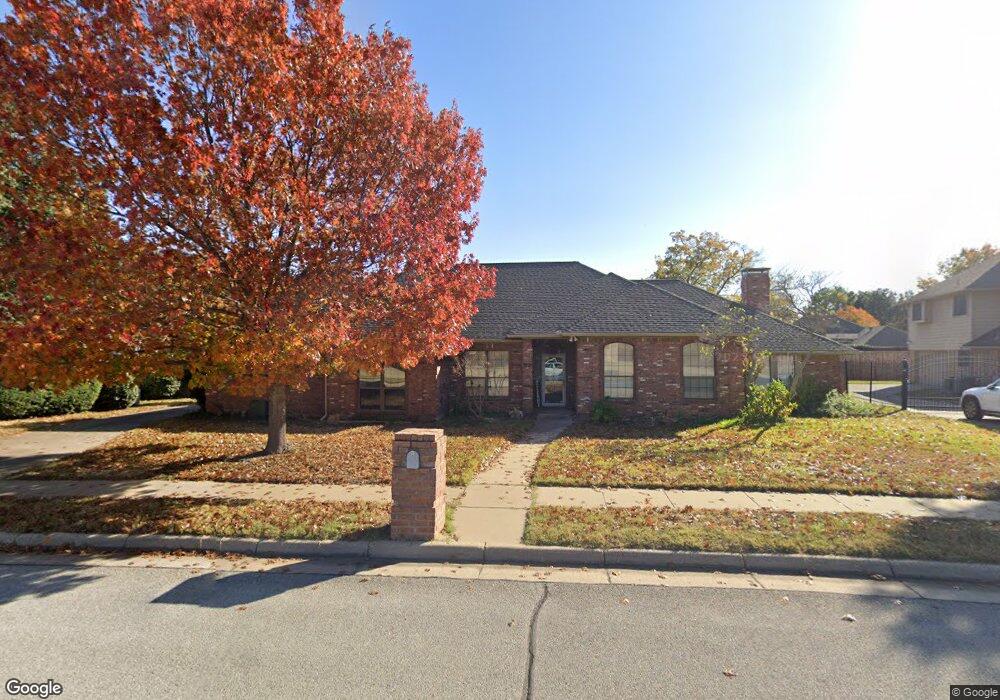
3820 Brookside Dr Bedford, TX 76021
Estimated Value: $578,000 - $674,443
4
Beds
3
Baths
3,328
Sq Ft
$191/Sq Ft
Est. Value
About This Home
This home is located at 3820 Brookside Dr, Bedford, TX 76021 and is currently estimated at $635,861, approximately $191 per square foot. 3820 Brookside Dr is a home located in Tarrant County with nearby schools including Spring Garden Elementary School, Harwood Junior High School, and Trinity High School.
Ownership History
Date
Name
Owned For
Owner Type
Purchase Details
Closed on
Oct 24, 2019
Sold by
Gunn Pamela L and Estate Of Richard T Gunn
Bought by
Gunn Pamela L
Current Estimated Value
Purchase Details
Closed on
May 23, 2012
Sold by
Wuistinger Danny and Wuistinger Deborah
Bought by
Gunn Richard T and Gunn Pamela L
Home Financials for this Owner
Home Financials are based on the most recent Mortgage that was taken out on this home.
Original Mortgage
$142,000
Outstanding Balance
$98,385
Interest Rate
3.9%
Mortgage Type
New Conventional
Estimated Equity
$537,476
Purchase Details
Closed on
Oct 20, 2005
Sold by
Rosetti Brian Charles and Rosetti Patricia Anne
Bought by
Wuistinger Danny and Wuistinger Deborah
Home Financials for this Owner
Home Financials are based on the most recent Mortgage that was taken out on this home.
Original Mortgage
$234,000
Interest Rate
5.73%
Mortgage Type
Fannie Mae Freddie Mac
Create a Home Valuation Report for This Property
The Home Valuation Report is an in-depth analysis detailing your home's value as well as a comparison with similar homes in the area
Home Values in the Area
Average Home Value in this Area
Purchase History
| Date | Buyer | Sale Price | Title Company |
|---|---|---|---|
| Gunn Pamela L | -- | None Available | |
| Gunn Richard T | -- | Lt | |
| Wuistinger Danny | -- | -- |
Source: Public Records
Mortgage History
| Date | Status | Borrower | Loan Amount |
|---|---|---|---|
| Open | Gunn Richard T | $142,000 | |
| Previous Owner | Wuistinger Danny | $234,000 |
Source: Public Records
Tax History Compared to Growth
Tax History
| Year | Tax Paid | Tax Assessment Tax Assessment Total Assessment is a certain percentage of the fair market value that is determined by local assessors to be the total taxable value of land and additions on the property. | Land | Improvement |
|---|---|---|---|---|
| 2025 | $5,029 | $690,635 | $95,000 | $595,635 |
| 2024 | $5,029 | $690,635 | $95,000 | $595,635 |
| 2023 | $11,427 | $605,723 | $66,500 | $539,223 |
| 2022 | $11,829 | $588,024 | $66,500 | $521,524 |
| 2021 | $11,598 | $492,366 | $66,500 | $425,866 |
| 2020 | $11,280 | $474,423 | $66,500 | $407,923 |
| 2019 | $10,769 | $475,373 | $66,500 | $408,873 |
| 2018 | $7,283 | $402,974 | $66,500 | $336,474 |
| 2017 | $9,133 | $411,017 | $35,000 | $376,017 |
| 2016 | $8,302 | $398,992 | $35,000 | $363,992 |
| 2015 | $7,560 | $312,000 | $35,000 | $277,000 |
| 2014 | $7,560 | $312,000 | $35,000 | $277,000 |
Source: Public Records
Map
Nearby Homes
- 3840 Edgewater Dr
- 2209 Laurel Ct
- 3813 Brookridge Ct
- Seaberry II Plan at Grace Park - Signature Series
- Primrose FE V Plan at Grace Park - Signature Series
- Hawthorne Plan at Grace Park - Signature Series
- Seaberry Plan at Grace Park - Signature Series
- Gardenia Plan at Grace Park - Signature Series
- Bellflower IV Plan at Grace Park - Signature Series
- Bellflower II Plan at Grace Park - Signature Series
- Carolina IV Plan at Grace Park - Signature Series
- Carolina Plan at Grace Park - Signature Series
- Violet III Plan at Grace Park - Signature Series
- Violet IV Plan at Grace Park - Signature Series
- Magnolia III Plan at Grace Park - Signature Series
- Violet II Plan at Grace Park - Signature Series
- Rose II Plan at Grace Park - Signature Series
- Magnolia II Plan at Grace Park - Signature Series
- Magnolia Plan at Grace Park - Signature Series
- Hawthorne II Plan at Grace Park - Signature Series
- 3824 Brookside Dr
- 3816 Brookside Dr
- 3825 Edgewater Dr
- 3829 Edgewater Dr
- 3833 Edgewater Dr
- 2008 Prescott Ct
- 3821 Edgewater Dr
- 3828 Brookside Dr
- 3812 Brookside Dr
- 3817 Edgewater Dr
- 3837 Edgewater Dr
- 3809 Brookside Dr
- 3832 Brookside Dr
- 3813 Edgewater Dr
- 3808 Brookside Dr
- 2004 Prescott Ct
- 2005 Prescott Ct
- 3756 Oak Cove Ln
- 3741 Oak Cove Ln
- 3841 Edgewater Dr