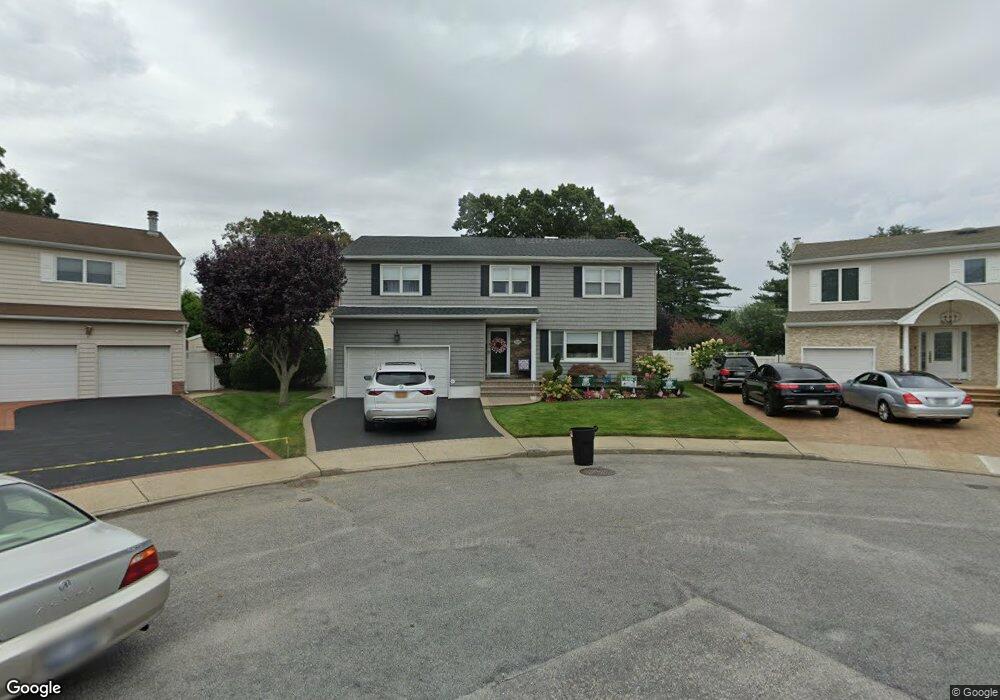
3820 Charles Ct Seaford, NY 11783
Estimated Value: $881,476 - $910,000
4
Beds
3
Baths
2,094
Sq Ft
$428/Sq Ft
Est. Value
About This Home
This home is located at 3820 Charles Ct, Seaford, NY 11783 and is currently estimated at $895,738, approximately $427 per square foot. 3820 Charles Ct is a home located in Nassau County with nearby schools including Seaford Middle School, Seaford Senior High School, and St. William the Abbot School.
Ownership History
Date
Name
Owned For
Owner Type
Purchase Details
Closed on
Mar 23, 2022
Sold by
Welti Kevin and Lozier Kristie
Bought by
Lozier Kristie
Current Estimated Value
Home Financials for this Owner
Home Financials are based on the most recent Mortgage that was taken out on this home.
Original Mortgage
$390,000
Outstanding Balance
$365,357
Interest Rate
4.16%
Mortgage Type
New Conventional
Estimated Equity
$530,381
Purchase Details
Closed on
Dec 18, 2013
Sold by
Obrien Joyces and Obrien Kenneth S
Bought by
Welti Kevin and Lozier Kristie
Home Financials for this Owner
Home Financials are based on the most recent Mortgage that was taken out on this home.
Original Mortgage
$410,975
Interest Rate
4.27%
Mortgage Type
Purchase Money Mortgage
Purchase Details
Closed on
Jul 12, 2002
Sold by
Eberhardt Henry
Bought by
Thousand Hills Properties
Create a Home Valuation Report for This Property
The Home Valuation Report is an in-depth analysis detailing your home's value as well as a comparison with similar homes in the area
Home Values in the Area
Average Home Value in this Area
Purchase History
| Date | Buyer | Sale Price | Title Company |
|---|---|---|---|
| Lozier Kristie | -- | Chicago Title Insurance Co | |
| Welti Kevin | $483,500 | -- | |
| Thousand Hills Properties | $150,000 | -- |
Source: Public Records
Mortgage History
| Date | Status | Borrower | Loan Amount |
|---|---|---|---|
| Open | Lozier Kristie | $390,000 | |
| Previous Owner | Welti Kevin | $410,975 |
Source: Public Records
Tax History Compared to Growth
Tax History
| Year | Tax Paid | Tax Assessment Tax Assessment Total Assessment is a certain percentage of the fair market value that is determined by local assessors to be the total taxable value of land and additions on the property. | Land | Improvement |
|---|---|---|---|---|
| 2025 | $14,899 | $534 | $157 | $377 |
| 2024 | $3,820 | $531 | $156 | $375 |
| 2023 | $12,140 | $550 | $162 | $388 |
| 2022 | $12,140 | $588 | $173 | $415 |
| 2021 | $16,552 | $618 | $182 | $436 |
| 2020 | $11,009 | $677 | $676 | $1 |
| 2019 | $3,569 | $725 | $697 | $28 |
| 2018 | $3,657 | $774 | $0 | $0 |
| 2017 | $7,771 | $822 | $513 | $309 |
| 2016 | $11,508 | $895 | $558 | $337 |
| 2015 | $4,735 | $1,193 | $719 | $474 |
| 2014 | $4,735 | $1,193 | $719 | $474 |
| 2013 | $4,440 | $1,193 | $744 | $449 |
Source: Public Records
Map
Nearby Homes
- 3809 Lincoln St
- 3860 Maplewood Dr
- 3862 Clark St
- 3902 Beechwood Place
- 1823 Lincoln Ave
- 1605 Henry Rd
- 1630 Temple Dr
- 1555 Henry Rd
- 3799 Mansfield Dr
- 3637 John St
- 3731 Park Ave
- 3615 Franklin St
- 3783 Charlotte Ct
- 1441 Roth Rd
- 3674 Park Ave Unit 1D
- 3888 Mill Rd
- 4037 Park Dr
- 1872 Park Dr
- 1420 Poulson St
- 1480 Adam Place