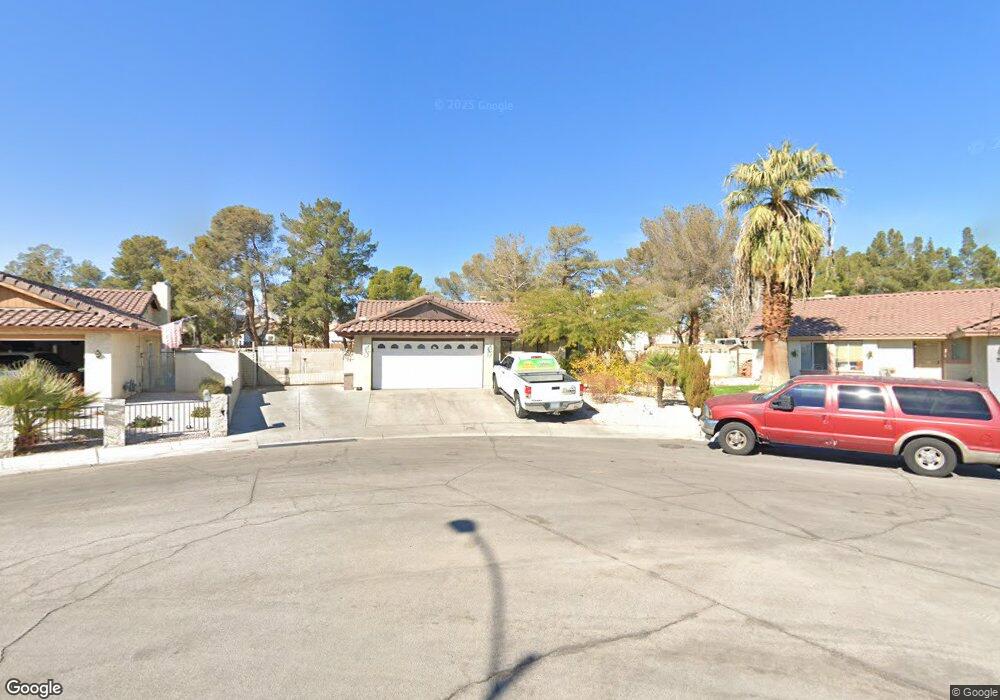
3820 Ivycrest St Las Vegas, NV 89108
Woodcrest NeighborhoodEstimated Value: $390,568 - $523,000
4
Beds
2
Baths
1,391
Sq Ft
$314/Sq Ft
Est. Value
About This Home
This home is located at 3820 Ivycrest St, Las Vegas, NV 89108 and is currently estimated at $436,892, approximately $314 per square foot. 3820 Ivycrest St is a home located in Clark County with nearby schools including R.E. Tobler Elementary School, Irwin & Susan Molasky Junior High School, and Cheyenne High School.
Ownership History
Date
Name
Owned For
Owner Type
Purchase Details
Closed on
Feb 3, 2023
Sold by
Jose M Valle Trust
Bought by
Valle Hector
Current Estimated Value
Purchase Details
Closed on
Feb 16, 2016
Sold by
Valle Hector E
Bought by
Jose M Valle Trust
Purchase Details
Closed on
Feb 28, 2006
Sold by
Riley Richard H
Bought by
Valle Hector E
Home Financials for this Owner
Home Financials are based on the most recent Mortgage that was taken out on this home.
Original Mortgage
$220,800
Interest Rate
6.04%
Mortgage Type
Stand Alone First
Purchase Details
Closed on
Aug 15, 1995
Sold by
Riley Irene A
Bought by
Riley Richard H
Home Financials for this Owner
Home Financials are based on the most recent Mortgage that was taken out on this home.
Original Mortgage
$99,950
Interest Rate
7.71%
Mortgage Type
FHA
Create a Home Valuation Report for This Property
The Home Valuation Report is an in-depth analysis detailing your home's value as well as a comparison with similar homes in the area
Home Values in the Area
Average Home Value in this Area
Purchase History
| Date | Buyer | Sale Price | Title Company |
|---|---|---|---|
| Valle Hector | -- | -- | |
| Jose M Valle Trust | -- | None Available | |
| Valle Hector E | $276,000 | Title One | |
| Riley Richard H | -- | Lawyers Title |
Source: Public Records
Mortgage History
| Date | Status | Borrower | Loan Amount |
|---|---|---|---|
| Previous Owner | Valle Hector E | $220,800 | |
| Previous Owner | Riley Richard H | $99,950 |
Source: Public Records
Tax History Compared to Growth
Tax History
| Year | Tax Paid | Tax Assessment Tax Assessment Total Assessment is a certain percentage of the fair market value that is determined by local assessors to be the total taxable value of land and additions on the property. | Land | Improvement |
|---|---|---|---|---|
| 2025 | $1,644 | $70,297 | $33,110 | $37,187 |
| 2024 | $2,321 | $70,297 | $33,110 | $37,187 |
| 2023 | $2,321 | $72,024 | $35,805 | $36,219 |
| 2022 | $1,411 | $63,852 | $30,415 | $33,437 |
| 2021 | $1,306 | $56,093 | $23,870 | $32,223 |
| 2020 | $1,210 | $57,738 | $25,410 | $32,328 |
| 2019 | $1,134 | $53,358 | $21,175 | $32,183 |
| 2018 | $1,082 | $51,299 | $20,020 | $31,279 |
| 2017 | $1,014 | $48,123 | $16,170 | $31,953 |
| 2016 | $1,014 | $44,564 | $12,075 | $32,489 |
| 2015 | $1,011 | $37,851 | $8,750 | $29,101 |
| 2014 | $981 | $29,048 | $8,750 | $20,298 |
Source: Public Records
Map
Nearby Homes
- 6465 Plumcrest Rd
- 3936 Applecrest St Unit 1
- 6556 Gatehouse Ln
- 3948 Applecrest St
- 3929 Dream St
- 6604 Gatehouse Ln
- 3805 Twig Ln
- 6641 Telegraph Rd
- 6645 Telegraph Rd
- 6609 Joe Michael Way
- 4012 Mira Ln
- 3757 N Torrey Pines Dr
- 6660 Joe Michael Way
- 6429 Roy Rogers Dr Unit 2
- 6440 Marrow Rd
- 3745 Colfax Cir
- 3605 N Torrey Pines Dr
- 3648 Glen Ridge Way
- 6700 Amarinta Ave Unit 103
- 3737 Broadriver Dr
- 6448 Vinecrest Ave
- 3816 Ivycrest St
- 6444 Vinecrest Ave
- 6461 Plumcrest Rd
- 6441 Vinecrest Ave
- 6457 Plumcrest Rd Unit 1
- 3900 Applecrest St Unit 1
- 6440 Vinecrest Ave
- 6453 Plumcrest Rd
- 3805 Dream St
- 3809 Dream St
- 3813 Dream St
- 3801 Dream St
- 3817 Dream St
- 3817 Dream St Unit 1
- 6449 Plumcrest Rd
- 6437 Vinecrest Ave
- 6440 Beechcrest Rd
- 3821 Dream St
- 3904 Applecrest St