Estimated Value: $343,625 - $402,000
3
Beds
2
Baths
1,680
Sq Ft
$228/Sq Ft
Est. Value
About This Home
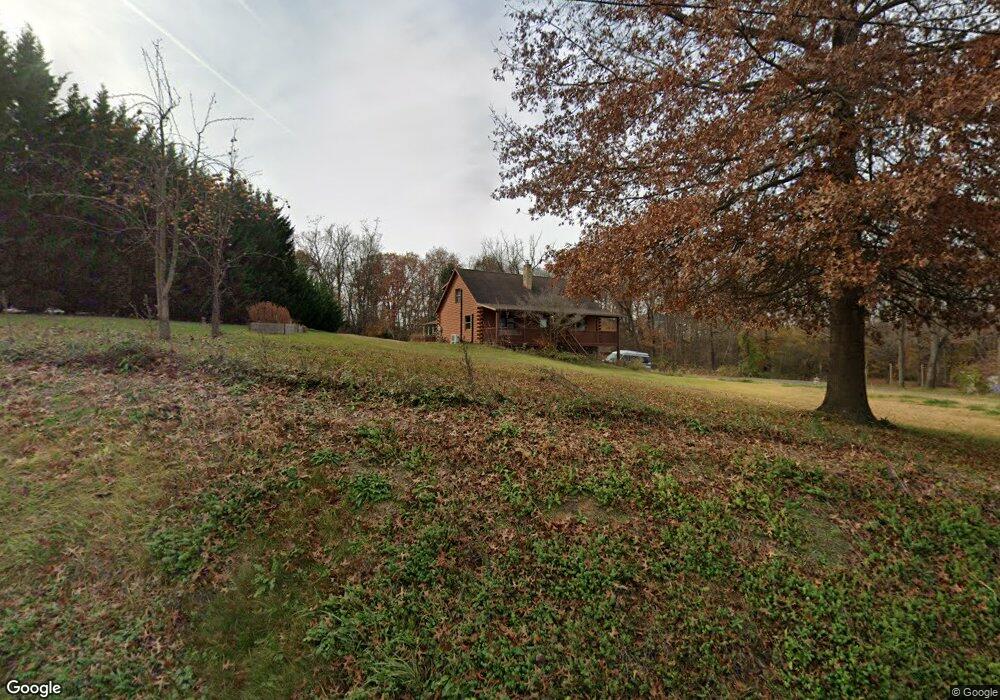
This home is located at 3820 N Susquehanna Trail, York, PA 17404 and is currently estimated at $382,406, approximately $227 per square foot. 3820 N Susquehanna Trail is a home located in York County with nearby schools including Central York High School, Bible Baptist Christian Academy, and Christian School of York.
Ownership History
Date
Name
Owned For
Owner Type
Purchase Details
Closed on
Jun 10, 2022
Sold by
Lieu Trong and Lieu Elizabeth
Bought by
Lieu Trong T
Current Estimated Value
Purchase Details
Closed on
Jan 10, 2018
Sold by
Phan Nam and Phan Olivia
Bought by
Lieu Elizabeth Ann and Lieu Trong Thai
Purchase Details
Closed on
Jun 30, 2003
Sold by
Biester Robert G and Biester Cynthia L
Bought by
Lieu Trong and Lieu Elizabeth
Home Financials for this Owner
Home Financials are based on the most recent Mortgage that was taken out on this home.
Original Mortgage
$185,000
Interest Rate
5.45%
Mortgage Type
Purchase Money Mortgage
Purchase Details
Closed on
Aug 13, 2001
Sold by
Emig Keith L and Emig Kristal L
Bought by
Biester Robert G
Home Financials for this Owner
Home Financials are based on the most recent Mortgage that was taken out on this home.
Original Mortgage
$123,200
Interest Rate
7.1%
Create a Home Valuation Report for This Property
The Home Valuation Report is an in-depth analysis detailing your home's value as well as a comparison with similar homes in the area
Home Values in the Area
Average Home Value in this Area
Purchase History
| Date | Buyer | Sale Price | Title Company |
|---|---|---|---|
| Lieu Trong T | -- | -- | |
| Lieu Elizabeth Ann | $80,000 | None Available | |
| Lieu Trong | $185,000 | Chicago Title Insurance Comp | |
| Biester Robert G | $154,000 | -- |
Source: Public Records
Mortgage History
| Date | Status | Borrower | Loan Amount |
|---|---|---|---|
| Previous Owner | Lieu Trong | $185,000 | |
| Previous Owner | Biester Robert G | $123,200 |
Source: Public Records
Tax History Compared to Growth
Tax History
| Year | Tax Paid | Tax Assessment Tax Assessment Total Assessment is a certain percentage of the fair market value that is determined by local assessors to be the total taxable value of land and additions on the property. | Land | Improvement |
|---|---|---|---|---|
| 2025 | $5,531 | $180,500 | $44,070 | $136,430 |
| 2024 | $5,373 | $180,500 | $44,070 | $136,430 |
| 2023 | $5,106 | $177,980 | $44,070 | $133,910 |
| 2022 | $5,024 | $177,980 | $44,070 | $133,910 |
| 2021 | $4,846 | $177,980 | $44,070 | $133,910 |
| 2020 | $4,846 | $177,980 | $44,070 | $133,910 |
| 2019 | $4,757 | $177,980 | $44,070 | $133,910 |
| 2018 | $4,654 | $177,980 | $44,070 | $133,910 |
| 2017 | $4,578 | $177,980 | $44,070 | $133,910 |
| 2016 | $0 | $177,980 | $44,070 | $133,910 |
| 2015 | -- | $177,980 | $44,070 | $133,910 |
| 2014 | -- | $177,980 | $44,070 | $133,910 |
Source: Public Records
Map
Nearby Homes
- Woodford Plan at Welbourne Reserve
- Sebastian Plan at Welbourne Reserve
- Covington Plan at Welbourne Reserve
- Parker Plan at Welbourne Reserve
- Lachlan Plan at Welbourne Reserve
- Harrison Plan at Welbourne Reserve
- Augusta Plan at Welbourne Reserve
- Magnolia Plan at Welbourne Reserve
- Arcadia Plan at Welbourne Reserve
- Andrews Plan at Welbourne Reserve
- Hawthorne Plan at Welbourne Reserve
- Addison Plan at Welbourne Reserve
- Nottingham Plan at Welbourne Reserve
- Kipling Plan at Welbourne Reserve
- Devonshire Plan at Welbourne Reserve
- Caldwell Plan at Welbourne Reserve
- Ethan Plan at Welbourne Reserve
- Savannah Plan at Welbourne Reserve
- 3545 Wildview Ln
- 3535 Wildview Ln
- 3816 N Susquehanna Trail
- 3830 N Susquehanna Trail
- 3840 N Susquehanna Trail
- 3800 N Susquehanna Trail
- 3835 N Susquehanna Trail
- 492 Darrow Rd
- 492 Darrow Rd Unit QDH
- 494 Darrow Rd
- 496 Darrow Rd
- 493 Darrow Rd
- 601 Kerria Dr
- 500 Darrow Rd
- 633 Kerria Dr
- 614 Kerria Dr
- 0 Darrow Rd Unit PAYK2012404
- 0 Darrow Rd
- 3865 N Susquehanna Trail
- 502 Darrow Rd
- 3898 N Susquehanna Trail
- 3898 N Susquehanna Trail Unit 1865294-9459