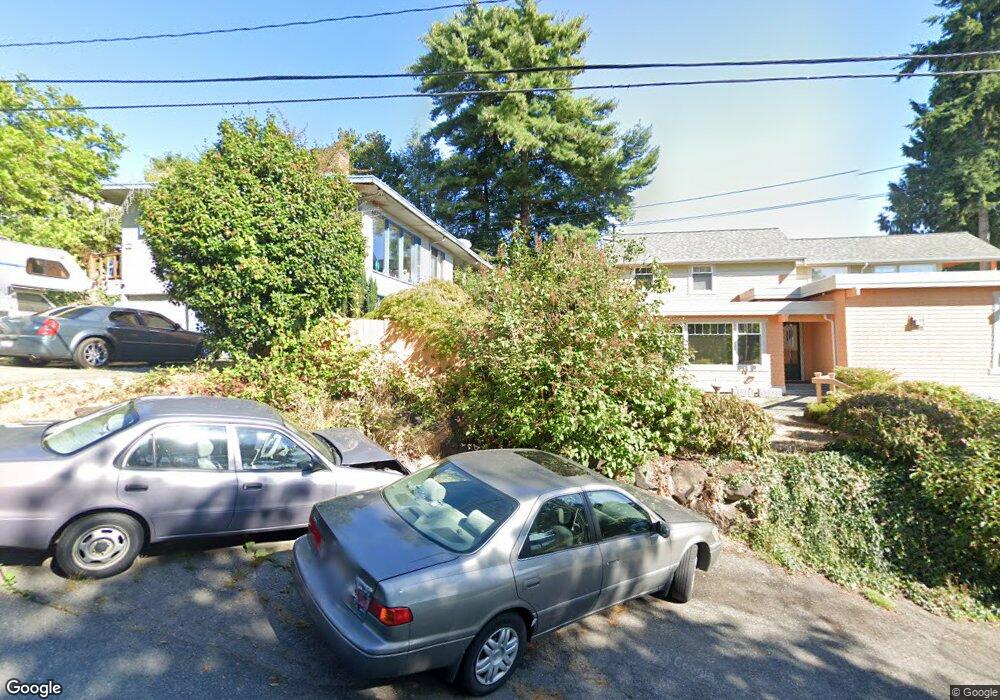
3820 NE 155th St Unit 102 Lake Forest Park, WA 98155
Sheridan Beach NeighborhoodEstimated Value: $465,360 - $479,000
2
Beds
1
Bath
1,248
Sq Ft
$378/Sq Ft
Est. Value
About This Home
This home is located at 3820 NE 155th St Unit 102, Lake Forest Park, WA 98155 and is currently estimated at $472,090, approximately $378 per square foot. 3820 NE 155th St Unit 102 is a home located in King County with nearby schools including Briarcrest Elementary School, Kellogg Middle School, and Shorecrest High School.
Ownership History
Date
Name
Owned For
Owner Type
Purchase Details
Closed on
Sep 14, 2022
Sold by
Kelly Mcentee
Bought by
Harris Richard R
Current Estimated Value
Purchase Details
Closed on
Jul 3, 2019
Sold by
Hoeft Clifford J and Hoeft Clifford
Bought by
Andrews Kelly
Home Financials for this Owner
Home Financials are based on the most recent Mortgage that was taken out on this home.
Original Mortgage
$332,500
Interest Rate
3.82%
Mortgage Type
New Conventional
Purchase Details
Closed on
Nov 20, 2000
Sold by
Bracher Regina A and Bracher Grant
Bought by
Hoeft Clifford J
Home Financials for this Owner
Home Financials are based on the most recent Mortgage that was taken out on this home.
Original Mortgage
$176,000
Interest Rate
7.86%
Mortgage Type
FHA
Purchase Details
Closed on
Jul 21, 1998
Sold by
Ackerman Annabelle
Bought by
Smith Regina A
Home Financials for this Owner
Home Financials are based on the most recent Mortgage that was taken out on this home.
Original Mortgage
$97,300
Interest Rate
7.01%
Create a Home Valuation Report for This Property
The Home Valuation Report is an in-depth analysis detailing your home's value as well as a comparison with similar homes in the area
Home Values in the Area
Average Home Value in this Area
Purchase History
| Date | Buyer | Sale Price | Title Company |
|---|---|---|---|
| Harris Richard R | $479,950 | First American Title | |
| Andrews Kelly | $350,000 | Old Republic Title Ltd | |
| Hoeft Clifford J | $182,500 | Chicago Title | |
| Smith Regina A | $139,000 | Transnation Title Insurance |
Source: Public Records
Mortgage History
| Date | Status | Borrower | Loan Amount |
|---|---|---|---|
| Previous Owner | Andrews Kelly | $332,500 | |
| Previous Owner | Hoeft Clifford J | $176,000 | |
| Previous Owner | Smith Regina A | $97,300 |
Source: Public Records
Tax History Compared to Growth
Tax History
| Year | Tax Paid | Tax Assessment Tax Assessment Total Assessment is a certain percentage of the fair market value that is determined by local assessors to be the total taxable value of land and additions on the property. | Land | Improvement |
|---|---|---|---|---|
| 2024 | $4,224 | $413,000 | $81,800 | $331,200 |
| 2023 | $3,248 | $444,000 | $74,800 | $369,200 |
| 2022 | $3,670 | $328,000 | $71,300 | $256,700 |
| 2021 | $3,759 | $324,000 | $70,100 | $253,900 |
| 2020 | $3,907 | $303,000 | $70,100 | $232,900 |
| 2018 | $3,081 | $310,000 | $63,100 | $246,900 |
| 2017 | $2,631 | $255,000 | $63,100 | $191,900 |
| 2016 | $2,637 | $224,000 | $61,900 | $162,100 |
| 2015 | $2,389 | $214,000 | $56,100 | $157,900 |
| 2014 | -- | $182,000 | $56,100 | $125,900 |
| 2013 | -- | $148,000 | $52,600 | $95,400 |
Source: Public Records
Map
Nearby Homes
- 3810 NE 155th St
- 15500 Bothell Way NE
- 15531 Lake Shore Blvd
- 15713 37th Ave NE
- 15020 Bothell Way NE Unit 303
- 14728 32nd Ave NE
- 14646 35th Ct NE
- 0 35th Ave NE Unit NWM2436375
- 16535 41st Ave NE
- 16526 Shore Dr NE
- 16505 Shore Dr NE
- 3641 NE 169th St
- 15535 26th Ave NE
- 14534 27th Ave NE
- 14363 30th Ave NE Unit 9
- 3024 NE 143rd St Unit 305
- 3024 NE 143rd St Unit 304
- 14026 Riviera Place NE
- 13757 39th Ave NE
- 4728 NE 172nd St
- 3820 NE 155th St Unit 801
- 3820 NE 155th St Unit 1001
- 3820 NE 155th St Unit 901
- 3820 NE 155th St
- 3820 NE 155th St Unit 403
- 3844 NE 155th St
- 3840 NE 155th St
- 3851 NE 155th St
- 3856 NE 155th St
- 3836 NE 155th St
- 3847 NE 155th Place
- 3839 NE 155th St
- 3832 NE 155th St
- 3860 NE 155th St
- 15415 Beach Dr NE
- 3825 NE 155th Place Unit 301
- 3825 NE 155th Place Unit 400
- 3825 NE 155th Place Unit 501
- 3825 NE 155th Place Unit 305
- 3825 NE 155th Place Unit 500