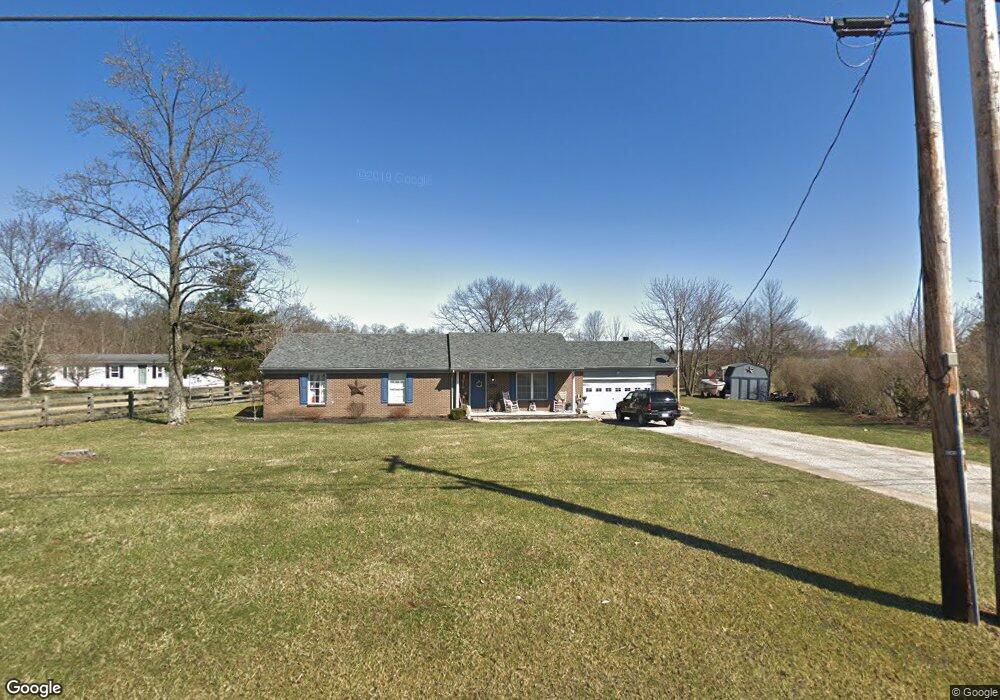
3820 State Line Rd Okeana, OH 45053
Estimated Value: $329,324 - $537,000
3
Beds
2
Baths
1,584
Sq Ft
$255/Sq Ft
Est. Value
About This Home
This home is located at 3820 State Line Rd, Okeana, OH 45053 and is currently estimated at $403,831, approximately $254 per square foot. 3820 State Line Rd is a home located in Butler County with nearby schools including Morgan Elementary School, Ross Intermediate School, and Ross Middle School.
Ownership History
Date
Name
Owned For
Owner Type
Purchase Details
Closed on
Dec 17, 2009
Sold by
Welsh Marc
Bought by
Barnes Justin
Current Estimated Value
Home Financials for this Owner
Home Financials are based on the most recent Mortgage that was taken out on this home.
Original Mortgage
$143,060
Outstanding Balance
$93,885
Interest Rate
5.02%
Mortgage Type
FHA
Estimated Equity
$309,946
Purchase Details
Closed on
Oct 18, 2008
Sold by
Reese Sheree A
Bought by
Welsh Marc
Purchase Details
Closed on
Oct 17, 2008
Sold by
Reese Richard John and Reese Sandra
Bought by
Reese Sheree A
Purchase Details
Closed on
Nov 20, 1998
Sold by
Reese Richard J
Bought by
Reese Sheree A
Home Financials for this Owner
Home Financials are based on the most recent Mortgage that was taken out on this home.
Original Mortgage
$76,800
Interest Rate
5.12%
Mortgage Type
Construction
Create a Home Valuation Report for This Property
The Home Valuation Report is an in-depth analysis detailing your home's value as well as a comparison with similar homes in the area
Home Values in the Area
Average Home Value in this Area
Purchase History
| Date | Buyer | Sale Price | Title Company |
|---|---|---|---|
| Barnes Justin | $148,000 | American Homeland Title Agen | |
| Welsh Marc | $60,000 | Ltoc | |
| Reese Sheree A | -- | Attorney | |
| Reese Sheree A | $7,360 | -- |
Source: Public Records
Mortgage History
| Date | Status | Borrower | Loan Amount |
|---|---|---|---|
| Open | Barnes Justin | $143,060 | |
| Previous Owner | Reese Sheree A | $76,800 |
Source: Public Records
Tax History Compared to Growth
Tax History
| Year | Tax Paid | Tax Assessment Tax Assessment Total Assessment is a certain percentage of the fair market value that is determined by local assessors to be the total taxable value of land and additions on the property. | Land | Improvement |
|---|---|---|---|---|
| 2024 | $3,409 | $96,010 | $15,260 | $80,750 |
| 2023 | $3,391 | $96,010 | $15,260 | $80,750 |
| 2022 | $2,575 | $64,950 | $15,260 | $49,690 |
| 2021 | $2,453 | $64,950 | $15,260 | $49,690 |
| 2020 | $2,563 | $64,950 | $15,260 | $49,690 |
| 2019 | $4,129 | $57,910 | $15,260 | $42,650 |
| 2018 | $2,304 | $57,910 | $15,260 | $42,650 |
| 2017 | $2,275 | $57,910 | $15,260 | $42,650 |
| 2016 | $2,105 | $51,800 | $13,080 | $38,720 |
| 2015 | $2,074 | $51,800 | $13,080 | $38,720 |
| 2014 | $2,098 | $51,800 | $13,080 | $38,720 |
| 2013 | $2,098 | $51,800 | $13,080 | $38,720 |
Source: Public Records
Map
Nearby Homes
- 4014 S State Line Rd
- 7768 Lorraine Dr
- 4105 Schoenling Rd
- 0 Bay Rd Unit 1860220
- 1 Bay Rd
- 4581 California Rd
- 0 Mortashed Rd
- 11675 New Biddinger Rd
- 10650 Lees Creek Rd
- 11529 Deer Trace Ln
- 0 Howards Creek Rd Unit 1851057
- 11140 New Biddinger Rd
- 10667 Hopping Rd
- 4380 Howards Creek Rd
- 10945 Carolina Trace Rd
- 10773 New Biddinger Rd
- 10485 New Biddinger Rd
- 10648 New Biddinger Rd
- 10630 New Biddinger Rd
- 10638 New Biddinger Rd
- 3856 Schoenling Rd
- 3798 State Line Rd
- 3877 Schoenling Rd
- 3894 State Line Rd
- 3894 State Line Rd
- 3760 State Line Rd
- 2018 State Line Rd
- 3907 Schoenling Rd
- 2020 State Line Rd
- 3748 State Line Rd
- 3748 State Line Rd
- 3756 State Line Rd
- 3956 S State Line Rd
- 3956 State Line Rd
- 3914 Schoenling Rd
- 3929 Schoenling Rd
- 2010 State Line Rd
- 3970 S State Line Rd
- 2144 State Line Rd