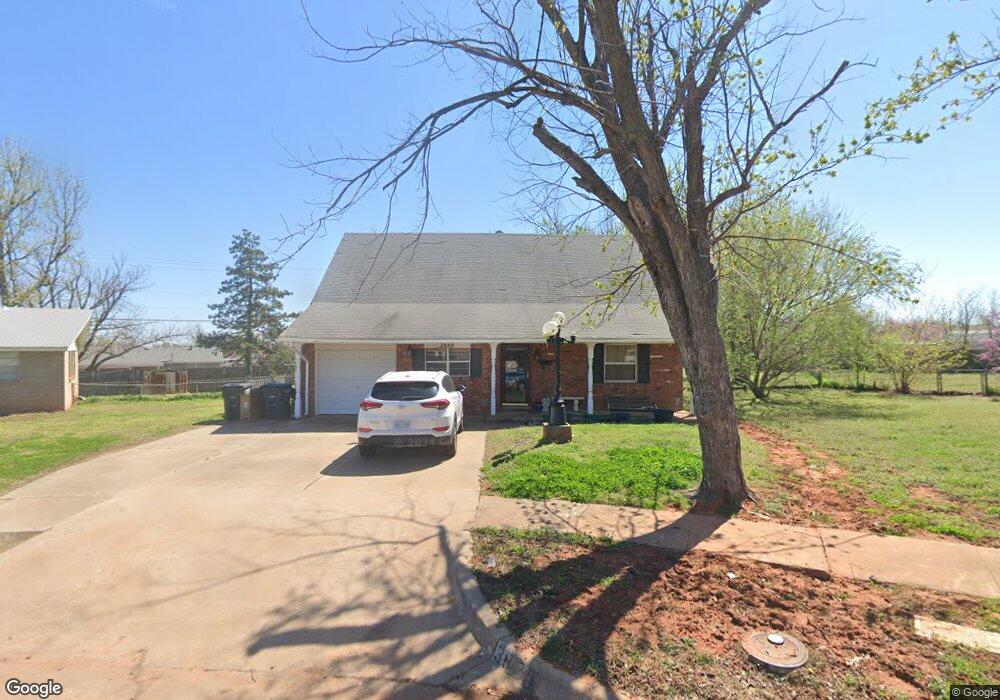
3820 Vick Cir Oklahoma City, OK 73115
Estimated Value: $187,307 - $199,000
4
Beds
3
Baths
1,568
Sq Ft
$122/Sq Ft
Est. Value
About This Home
This home is located at 3820 Vick Cir, Oklahoma City, OK 73115 and is currently estimated at $191,827, approximately $122 per square foot. 3820 Vick Cir is a home located in Oklahoma County with nearby schools including Epperly Heights Elementary School, Del City High School, and Christian Heritage Academy.
Ownership History
Date
Name
Owned For
Owner Type
Purchase Details
Closed on
May 29, 2013
Sold by
Mosher Merlin A and Mosher Carrie L
Bought by
Miner Sharne R and Miner Tami J
Current Estimated Value
Home Financials for this Owner
Home Financials are based on the most recent Mortgage that was taken out on this home.
Original Mortgage
$112,875
Outstanding Balance
$80,078
Interest Rate
3.43%
Mortgage Type
VA
Estimated Equity
$111,749
Purchase Details
Closed on
Jun 30, 2008
Sold by
Medley Billy L and Medley Elizabeth M
Bought by
Mosher Merlin A and Mosher Carrie L
Home Financials for this Owner
Home Financials are based on the most recent Mortgage that was taken out on this home.
Original Mortgage
$91,350
Interest Rate
6.11%
Mortgage Type
FHA
Purchase Details
Closed on
Sep 28, 1999
Sold by
Medley Billy L and Medley Elizabeth M
Bought by
Medley Billy L and Medley Elizabeth M
Create a Home Valuation Report for This Property
The Home Valuation Report is an in-depth analysis detailing your home's value as well as a comparison with similar homes in the area
Home Values in the Area
Average Home Value in this Area
Purchase History
| Date | Buyer | Sale Price | Title Company |
|---|---|---|---|
| Miner Sharne R | $12,383 | Stewart Abstract & Title | |
| Mosher Merlin A | $99,000 | Lawyers Title Of Ok City Inc | |
| Medley Billy L | -- | -- |
Source: Public Records
Mortgage History
| Date | Status | Borrower | Loan Amount |
|---|---|---|---|
| Open | Miner Sharne R | $112,875 | |
| Closed | Mosher Merlin A | $91,350 |
Source: Public Records
Tax History Compared to Growth
Tax History
| Year | Tax Paid | Tax Assessment Tax Assessment Total Assessment is a certain percentage of the fair market value that is determined by local assessors to be the total taxable value of land and additions on the property. | Land | Improvement |
|---|---|---|---|---|
| 2024 | $1,740 | $16,244 | $1,674 | $14,570 |
| 2023 | $1,740 | $15,470 | $1,828 | $13,642 |
| 2022 | $1,632 | $14,734 | $1,882 | $12,852 |
| 2021 | $1,610 | $14,033 | $2,161 | $11,872 |
| 2020 | $1,574 | $13,365 | $1,898 | $11,467 |
| 2019 | $1,490 | $13,051 | $1,823 | $11,228 |
| 2018 | $1,439 | $12,430 | $0 | $0 |
| 2017 | $1,430 | $12,264 | $1,898 | $10,366 |
| 2016 | $1,457 | $12,154 | $1,898 | $10,256 |
| 2015 | $1,450 | $12,033 | $1,898 | $10,135 |
| 2014 | $1,447 | $12,033 | $1,898 | $10,135 |
Source: Public Records
Map
Nearby Homes
- 3900 Corbett Dr
- 3900 Chetwood Dr
- 4113 Monica Dr
- 4121 SE 41st St
- 3513 Terry Way
- 4125 Overland Dr
- 4113 SE 43rd St
- 4308 Sunnylane Cir
- 4300 SE 37th St
- 3916 SE 46th St
- 4712 Royal Oak Dr
- 3220 Greenbrier Terrace
- 3232 Simmons Dr
- 4709 S Dimple Dr
- 3205 Overland Dr
- 3200 Neighbors Ln
- 3405 Hillside Dr
- 4012 SE 47th St
- 3105 Neighbors Ln
- 4805 S Dimple Dr
- 3824 Vick Cir
- 3816 Vick Cir
- 3901 Veterans Ln
- 3905 Veterans Ln
- 3901 Corbett Dr
- 3817 Veterans Ln
- 3909 Veterans Ln
- 3821 Vick Cir
- 3821 Corbett Dr
- 3909 Corbett Dr
- 3813 Veterans Ln
- 4001 Corbett Dr
- 3817 Corbett Dr
- 3817 Vick Cir
- 4005 Corbett Dr
- 3809 Veterans Ln
- 3808 Vick Cir
- 3813 Vick Cir
- 4009 Corbett Dr
- 3813 Corbett Dr