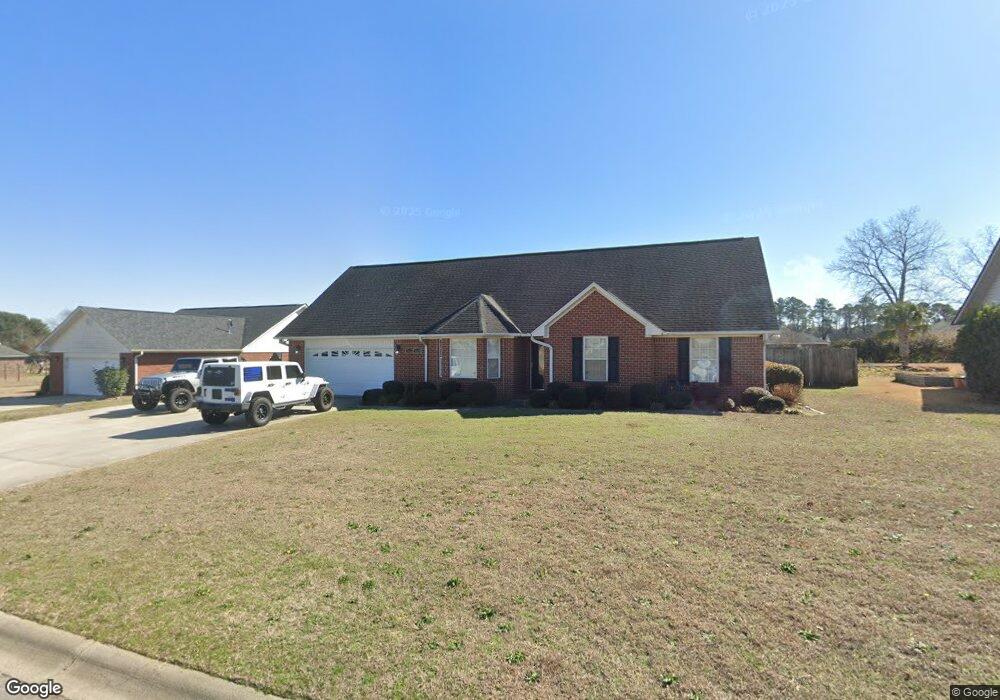
3820 Vinca St Sumter, SC 29154
Estimated Value: $260,621 - $266,000
3
Beds
2
Baths
1,766
Sq Ft
$149/Sq Ft
Est. Value
About This Home
This home is located at 3820 Vinca St, Sumter, SC 29154 and is currently estimated at $263,655, approximately $149 per square foot. 3820 Vinca St is a home located in Sumter County with nearby schools including Oakland Primary School, Shaw Heights Elementary School, and High Hills Elementary School.
Ownership History
Date
Name
Owned For
Owner Type
Purchase Details
Closed on
Oct 14, 2024
Sold by
Heredia Sandra D and Heredia Reinaldo
Bought by
Heredia Reinaldo V and Heredia Sandra D
Current Estimated Value
Purchase Details
Closed on
Dec 21, 2010
Sold by
Samuel Derrick and Blanding Latonya J
Bought by
Heredia Sandra D and Heredia Reinaldo
Home Financials for this Owner
Home Financials are based on the most recent Mortgage that was taken out on this home.
Original Mortgage
$168,458
Interest Rate
5.5%
Mortgage Type
FHA
Purchase Details
Closed on
Jun 30, 2006
Sold by
Benchmark Construction Of Sumter Llc
Bought by
Samuel Derrick and Blanding Latonya J
Purchase Details
Closed on
Jan 24, 2006
Sold by
Wintergreen Ii Of Sumter Llc
Bought by
Beachmark Construction Of Sumter Llc
Create a Home Valuation Report for This Property
The Home Valuation Report is an in-depth analysis detailing your home's value as well as a comparison with similar homes in the area
Home Values in the Area
Average Home Value in this Area
Purchase History
| Date | Buyer | Sale Price | Title Company |
|---|---|---|---|
| Heredia Reinaldo V | -- | None Listed On Document | |
| Heredia Sandra D | $146,500 | -- | |
| Samuel Derrick | $156,000 | None Available | |
| Beachmark Construction Of Sumter Llc | $25,000 | None Available |
Source: Public Records
Mortgage History
| Date | Status | Borrower | Loan Amount |
|---|---|---|---|
| Previous Owner | Heredia Sandra D | $168,458 |
Source: Public Records
Tax History Compared to Growth
Tax History
| Year | Tax Paid | Tax Assessment Tax Assessment Total Assessment is a certain percentage of the fair market value that is determined by local assessors to be the total taxable value of land and additions on the property. | Land | Improvement |
|---|---|---|---|---|
| 2024 | $59 | $0 | $0 | $0 |
| 2023 | $59 | $12,670 | $1,440 | $11,230 |
| 2022 | $4,728 | $12,670 | $1,440 | $11,230 |
| 2021 | $4,306 | $12,670 | $1,440 | $11,230 |
| 2020 | $4,306 | $11,240 | $1,440 | $9,800 |
| 2019 | $4,286 | $11,240 | $1,440 | $9,800 |
| 2018 | $0 | $7,500 | $960 | $6,540 |
| 2017 | $1,413 | $7,390 | $960 | $6,430 |
| 2016 | $1,435 | $7,390 | $960 | $6,430 |
| 2015 | $1,396 | $7,310 | $1,000 | $6,310 |
| 2014 | $1,396 | $6,930 | $1,000 | $5,930 |
| 2013 | -- | $6,930 | $1,000 | $5,930 |
Source: Public Records
Map
Nearby Homes
- 60 Vinca Ct
- 3720 Vinca St
- 3105 Oleander Dr
- 1625 & 1645 Suber St
- 3740 Oleander Dr
- 3315 Oleander Dr
- 1635 Carissa Dr
- 3389 Wilton Dr
- 3915 Peakvalley Rd
- 1928 Flagpole Dr Unit Lot 459
- Trenton Plan at Canopy of Oaks - Canopy Of Oaks @ Hunter's Crossing
- Brentwood Plan at Canopy of Oaks - Canopy Of Oaks @ Hunter's Crossing
- Langley Plan at Canopy of Oaks - Canopy Of Oaks @ Hunter's Crossing
- Benjamin Plan at Canopy of Oaks - Canopy Of Oaks @ Hunter's Crossing
- Dean Plan at Canopy of Oaks - Canopy Of Oaks @ Hunter's Crossing
- Maddox Plan at Canopy of Oaks - Canopy Of Oaks @ Hunter's Crossing
- Pittman Plan at Canopy of Oaks - Canopy Of Oaks @ Hunter's Crossing
- Portia Plan at Canopy of Oaks - Canopy Of Oaks @ Hunter's Crossing
- Meadowbrook Plan at Canopy of Oaks - Canopy Of Oaks @ Hunter's Crossing
- 1864 Gabriel Ln
- 3830 Vinca St
- 3810 Vinca St
- 3835 Vinca St
- 3840 Vinca St
- 3825 Rhododendron St
- 3835 Rhododendron St
- 1805 Escallonia Dr
- 3800 Vinca St
- 3815 Rhododendron St
- 3845 Rhododendron St
- 1800 Photina St
- 1800 Photinia St
- 3850 Vinca St
- 1815 Escallonia Dr
- 3805 Rhododendron St
- 1815 Escallonia Dr
- 3855 Rhododendron St
- 3855 Vinca St
- 1800 Escallonia Dr
- 3795 Rhododendron St