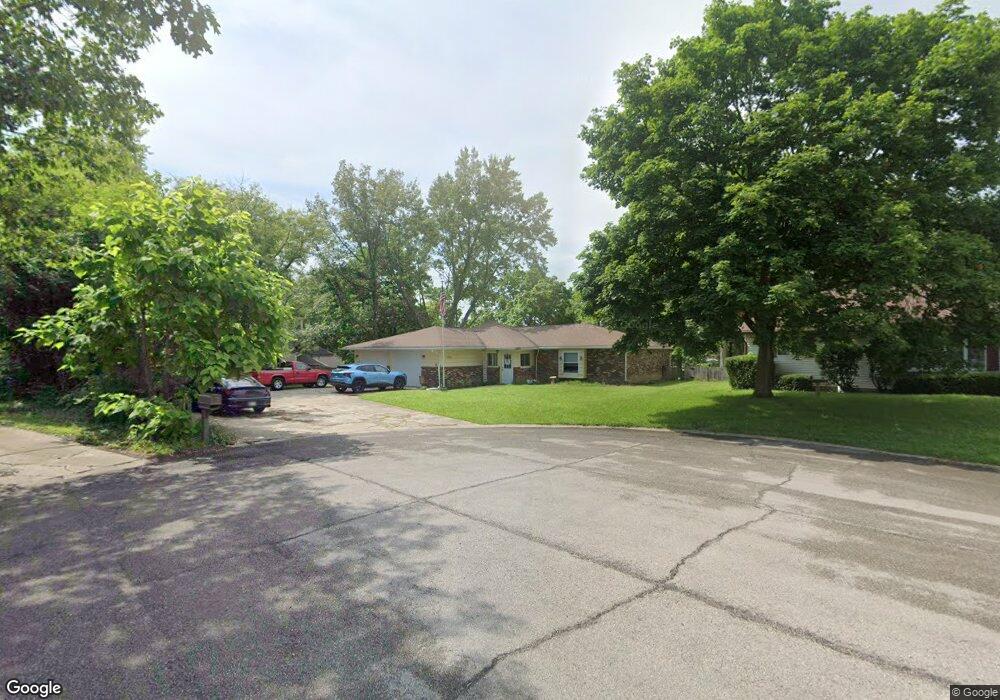
3820 W Shellbark Ct Unit Muncie Muncie, IN 47304
Estimated Value: $179,000 - $227,653
3
Beds
3
Baths
2,096
Sq Ft
$98/Sq Ft
Est. Value
About This Home
This home is located at 3820 W Shellbark Ct Unit Muncie, Muncie, IN 47304 and is currently estimated at $204,413, approximately $97 per square foot. 3820 W Shellbark Ct Unit Muncie is a home located in Delaware County with nearby schools including West View Elementary School, Muncie Central High School, and Northside Middle School.
Ownership History
Date
Name
Owned For
Owner Type
Purchase Details
Closed on
Mar 1, 2024
Sold by
Clay Lance Lorenz
Bought by
Berry Callie R and Lohmiller Dalton
Current Estimated Value
Home Financials for this Owner
Home Financials are based on the most recent Mortgage that was taken out on this home.
Original Mortgage
$110,000
Outstanding Balance
$108,191
Interest Rate
6.69%
Mortgage Type
New Conventional
Estimated Equity
$96,222
Purchase Details
Closed on
Dec 20, 2018
Sold by
Nanko Raymond S and Nanko Veronica M
Bought by
Clay Lance Lorenz
Home Financials for this Owner
Home Financials are based on the most recent Mortgage that was taken out on this home.
Original Mortgage
$134,900
Interest Rate
4.8%
Mortgage Type
VA
Create a Home Valuation Report for This Property
The Home Valuation Report is an in-depth analysis detailing your home's value as well as a comparison with similar homes in the area
Home Values in the Area
Average Home Value in this Area
Purchase History
| Date | Buyer | Sale Price | Title Company |
|---|---|---|---|
| Berry Callie R | -- | None Listed On Document | |
| Berry Callie R | -- | None Listed On Document | |
| Clay Lance Lorenz | -- | None Available |
Source: Public Records
Mortgage History
| Date | Status | Borrower | Loan Amount |
|---|---|---|---|
| Open | Berry Callie R | $110,000 | |
| Closed | Berry Callie R | $110,000 | |
| Previous Owner | Clay Lance Lorenz | $134,900 |
Source: Public Records
Tax History Compared to Growth
Tax History
| Year | Tax Paid | Tax Assessment Tax Assessment Total Assessment is a certain percentage of the fair market value that is determined by local assessors to be the total taxable value of land and additions on the property. | Land | Improvement |
|---|---|---|---|---|
| 2024 | $1,975 | $185,700 | $26,200 | $159,500 |
| 2023 | $781 | $173,900 | $21,900 | $152,000 |
| 2022 | $1,831 | $169,900 | $21,900 | $148,000 |
| 2021 | $1,710 | $157,800 | $21,800 | $136,000 |
| 2020 | $1,461 | $133,100 | $19,800 | $113,300 |
| 2019 | $1,461 | $133,100 | $19,800 | $113,300 |
| 2018 | $1,318 | $129,100 | $18,900 | $110,200 |
| 2017 | $2,557 | $121,700 | $17,000 | $104,700 |
| 2016 | $2,443 | $116,000 | $16,200 | $99,800 |
| 2014 | $2,428 | $118,500 | $15,300 | $103,200 |
| 2013 | -- | $117,400 | $15,300 | $102,100 |
Source: Public Records
Map
Nearby Homes
- 1130 N Bittersweet Ln
- 1201 N Bittersweet Ln
- 705 N Bittersweet Ln
- 4208 W Thornwood Ln
- 1212 N Bittersweet Ln
- 4208 W University Ave
- 3313 W Torquay Rd
- 1212 N Wildwood Ln
- 1408 N Regency Pkwy
- 1213 N Regency Pkwy
- 3305 W Petty Rd
- 1303 N Brentwood Ln
- 205 N Shellbark Rd
- 615 N Kylewood Dr
- 115 N Bittersweet Ln
- 4601 W Legacy Dr
- 307 N Winthrop Rd
- 916 N Alden Rd
- 4208 W Robinwood Dr
- 1806 N Forest Ave
- 3820 W Shellbark Ct
- 3816 W Shellbark Ct
- 907 N Tyrone Dr
- 1000 N Tyrone Dr
- 905 N Tyrone Dr
- 3815 W Shellbark Ct
- 901 N Tyrone Dr
- 1001 N Tyrone Dr
- 909 N Shellbark Rd
- 1006 N Tyrone Dr
- 1001 N Shellbark Rd
- 3811 W Shellbark Ct
- 811 N Tyrone Dr
- 904 N Clarkdale Dr
- 902 N Clarkdale Dr
- 906 N Clarkdale Dr
- 1005 N Tyrone Dr
- 1003 N Shellbark Rd