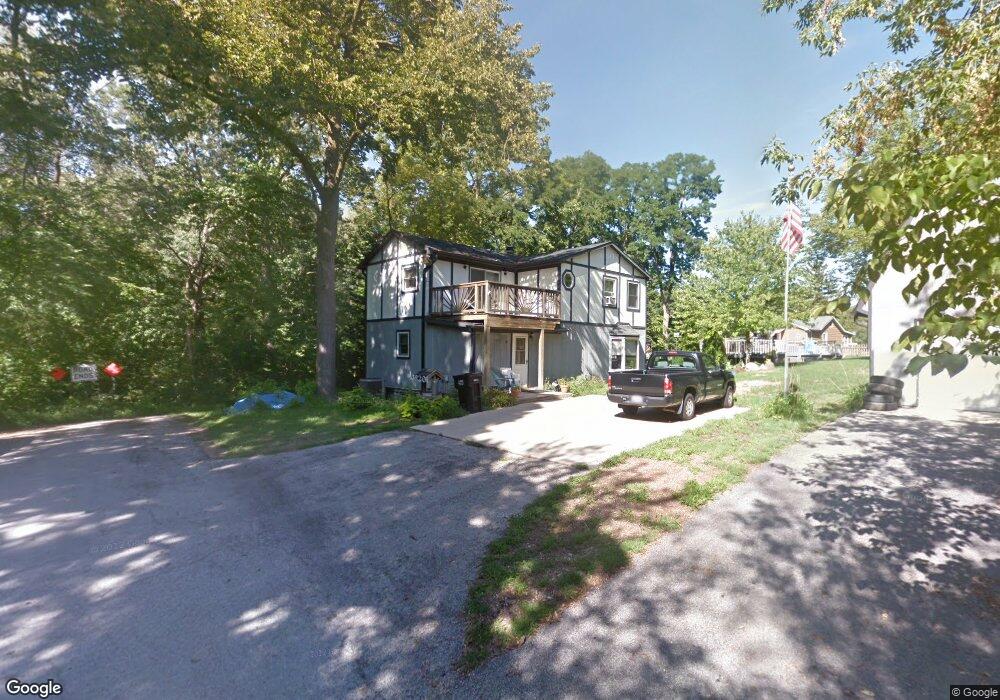
38201 N 1st Ave Spring Grove, IL 60081
Northeast Fox Lake NeighborhoodEstimated Value: $220,000 - $239,000
2
Beds
2
Baths
1,056
Sq Ft
$217/Sq Ft
Est. Value
About This Home
This home is located at 38201 N 1st Ave, Spring Grove, IL 60081 and is currently estimated at $229,481, approximately $217 per square foot. 38201 N 1st Ave is a home located in Lake County with nearby schools including Lotus Elementary School, Stanton Middle School, and Grant Community High School.
Ownership History
Date
Name
Owned For
Owner Type
Purchase Details
Closed on
Aug 23, 2021
Sold by
Ukleja Frank and Ukleja Patricia
Bought by
Ukleja Frank E and Ukleja Patricia A
Current Estimated Value
Home Financials for this Owner
Home Financials are based on the most recent Mortgage that was taken out on this home.
Original Mortgage
$157,102
Interest Rate
2.88%
Mortgage Type
FHA
Purchase Details
Closed on
Jun 13, 2003
Sold by
Szot Mitchell E and Szot Irene E
Bought by
Ukleja Donald A
Purchase Details
Closed on
Apr 3, 2002
Sold by
Lauts Nada
Bought by
Ukleja Donald
Home Financials for this Owner
Home Financials are based on the most recent Mortgage that was taken out on this home.
Original Mortgage
$164,800
Interest Rate
7.18%
Purchase Details
Closed on
Jan 9, 2002
Sold by
Segadi John
Bought by
Lauts Nada
Create a Home Valuation Report for This Property
The Home Valuation Report is an in-depth analysis detailing your home's value as well as a comparison with similar homes in the area
Home Values in the Area
Average Home Value in this Area
Purchase History
| Date | Buyer | Sale Price | Title Company |
|---|---|---|---|
| Ukleja Frank E | $160,000 | Gmt Title Agency | |
| Ukleja Donald A | $12,000 | -- | |
| Ukleja Donald | -- | -- | |
| Lauts Nada | -- | -- |
Source: Public Records
Mortgage History
| Date | Status | Borrower | Loan Amount |
|---|---|---|---|
| Previous Owner | Ukleja Frank E | $157,102 | |
| Previous Owner | Ukleja Donald | $164,800 |
Source: Public Records
Tax History Compared to Growth
Tax History
| Year | Tax Paid | Tax Assessment Tax Assessment Total Assessment is a certain percentage of the fair market value that is determined by local assessors to be the total taxable value of land and additions on the property. | Land | Improvement |
|---|---|---|---|---|
| 2024 | $2,510 | $52,872 | $4,923 | $47,949 |
| 2023 | $3,177 | $47,342 | $4,408 | $42,934 |
| 2022 | $3,177 | $49,333 | $6,358 | $42,975 |
| 2021 | $3,242 | $48,999 | $8,899 | $40,100 |
| 2020 | $3,166 | $47,646 | $8,653 | $38,993 |
| 2019 | $2,963 | $45,564 | $8,275 | $37,289 |
| 2018 | $2,765 | $42,870 | $8,377 | $34,493 |
| 2017 | $2,715 | $40,806 | $7,974 | $32,832 |
| 2016 | $2,867 | $39,380 | $7,695 | $31,685 |
| 2015 | $2,867 | $38,378 | $7,499 | $30,879 |
| 2014 | $2,738 | $44,357 | $11,189 | $33,168 |
| 2012 | $2,550 | $46,103 | $11,189 | $34,914 |
Source: Public Records
Map
Nearby Homes
- 38227 N 3rd Ave
- 27771 W Lake Shore Dr
- 38408 N Primrose Path
- 27849 W Lake Shore Dr
- 38366 N 4th Ave
- 38433 N 5th Ave
- 38480 N 6th Ave
- 38581 N Hillandale Dr
- 38623 N Konen Ave
- 6712 Perkins Pkwy
- 171 Waltonian Terrace
- 38717 N Lake St
- 27726 Hill Dr
- 8002 Honeysuckle Ct Unit T5A
- 39071 N Jackson Dr
- 978 Eastshore Dr
- 149 Forest Ave Unit D
- 138 Cora Ave
- Lots 11 & 12 W Ravine Dr
- Lots 8 & 9 W Ravine Dr
- 27630 W Lake Shore Dr
- 27610 W Lake Shore Dr
- 27584 W Lake Shore Dr
- 27580 W Lake Shore Dr
- 38200 N 1st Ave
- 38235 N 1st Ave
- 38178 N 1st Ave
- 27576 W Lake Shore Dr
- 38228 N 1st Ave
- 38170 N 1st Ave
- 27669 W Belden Ave
- 27572 W Lake Shore Dr
- 38160 N 1st Ave
- 38189 N 2nd Ave
- 38201 N 2nd Ave
- 27631 W Lake Shore Dr
- 38267 N Hamilton Cir
- 38211 N 2nd Ave
- 27623 W Lake Shore Dr
- 27639 W Lake Shore Dr