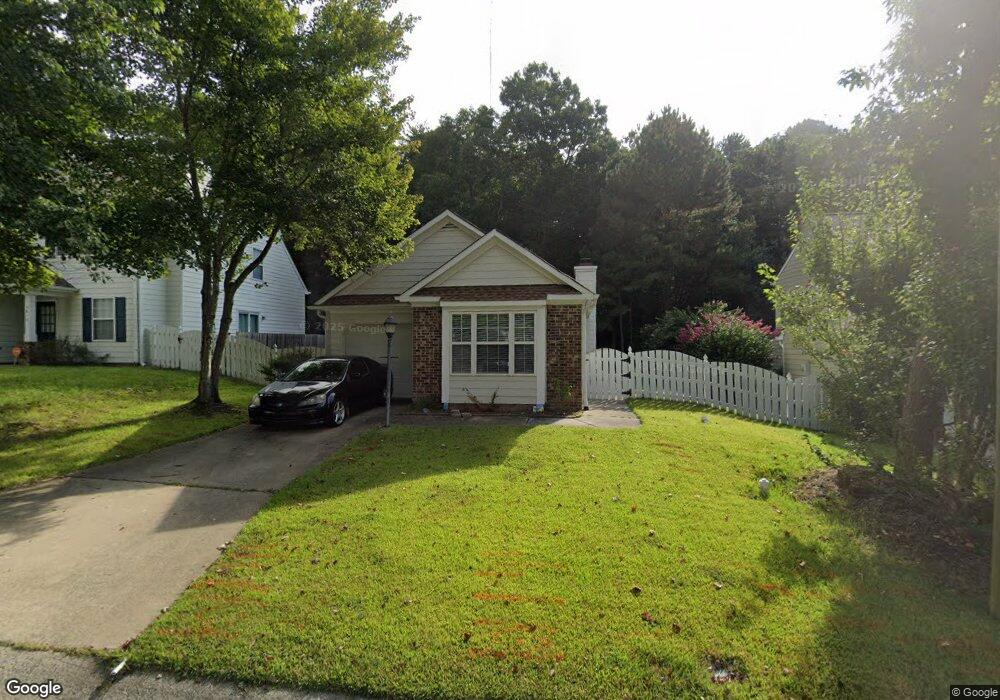
3821 Northlake Dr Durham, NC 27703
Eastern Durham NeighborhoodEstimated Value: $292,000 - $309,000
3
Beds
2
Baths
1,095
Sq Ft
$273/Sq Ft
Est. Value
About This Home
This home is located at 3821 Northlake Dr, Durham, NC 27703 and is currently estimated at $299,350, approximately $273 per square foot. 3821 Northlake Dr is a home located in Durham County with nearby schools including Oak Grove Elementary, John W Neal Middle School, and Southern School of Energy & Sustainability.
Ownership History
Date
Name
Owned For
Owner Type
Purchase Details
Closed on
Jun 12, 2019
Sold by
Hinton Richard and Hinton Verita
Bought by
Snoddy Stephen M
Current Estimated Value
Home Financials for this Owner
Home Financials are based on the most recent Mortgage that was taken out on this home.
Original Mortgage
$174,200
Outstanding Balance
$153,164
Interest Rate
4.1%
Mortgage Type
New Conventional
Estimated Equity
$146,186
Purchase Details
Closed on
Jan 18, 2002
Sold by
Allen Connie G and Allen Glenwood
Bought by
Hinton Richard
Home Financials for this Owner
Home Financials are based on the most recent Mortgage that was taken out on this home.
Original Mortgage
$121,890
Interest Rate
7.08%
Mortgage Type
VA
Purchase Details
Closed on
Aug 11, 1998
Sold by
D R Horton Inc Torrey
Bought by
Gray Connie L
Home Financials for this Owner
Home Financials are based on the most recent Mortgage that was taken out on this home.
Original Mortgage
$104,600
Interest Rate
6.96%
Create a Home Valuation Report for This Property
The Home Valuation Report is an in-depth analysis detailing your home's value as well as a comparison with similar homes in the area
Home Values in the Area
Average Home Value in this Area
Purchase History
| Date | Buyer | Sale Price | Title Company |
|---|---|---|---|
| Snoddy Stephen M | $180,000 | None Available | |
| Hinton Richard | $119,500 | -- | |
| Gray Connie L | $108,000 | -- |
Source: Public Records
Mortgage History
| Date | Status | Borrower | Loan Amount |
|---|---|---|---|
| Open | Snoddy Stephen M | $174,200 | |
| Previous Owner | Hinton Richard | $121,890 | |
| Previous Owner | Gray Connie L | $104,600 |
Source: Public Records
Tax History Compared to Growth
Tax History
| Year | Tax Paid | Tax Assessment Tax Assessment Total Assessment is a certain percentage of the fair market value that is determined by local assessors to be the total taxable value of land and additions on the property. | Land | Improvement |
|---|---|---|---|---|
| 2025 | $2,723 | $274,684 | $60,182 | $214,502 |
| 2024 | $2,372 | $170,075 | $43,837 | $126,238 |
| 2023 | $2,228 | $170,075 | $43,837 | $126,238 |
| 2022 | $2,177 | $170,075 | $43,837 | $126,238 |
| 2021 | $2,167 | $170,075 | $43,837 | $126,238 |
| 2020 | $2,116 | $170,075 | $43,837 | $126,238 |
| 2019 | $2,116 | $170,075 | $43,837 | $126,238 |
| 2018 | $1,771 | $130,579 | $32,147 | $98,432 |
| 2017 | $1,758 | $130,579 | $32,147 | $98,432 |
| 2016 | $1,699 | $130,579 | $32,147 | $98,432 |
| 2015 | $1,667 | $120,423 | $26,767 | $93,656 |
| 2014 | $1,667 | $120,423 | $26,767 | $93,656 |
Source: Public Records
Map
Nearby Homes
- 503 Bellmeade Bay Dr
- 301 Sylvias Ct
- 1 Kings Grant Ct
- 2117 Fletchers Ridge Dr
- 128 Leacroft Way
- 537 Crossview Ln
- 715 Southshore Pkwy
- 615 Southshore Pkwy
- 208 Lick Creek Ln
- 110 Kindlewood Dr
- 405 S Mineral Springs Rd
- 106 Newberry Ln
- 416 Chivalry Dr
- 506 Currin St
- 210 Stoney Creek Cir
- 16 Vestrial Ln
- 103 Bermuda Green Dr
- 402 Robbins Rd
- 406 Robbins Rd
- 1 Thorn Brook Ct
- 3823 Northlake Dr
- 3819 Northlake Dr
- 3827 Northlake Dr
- 3817 Northlake Dr
- 3815 Northlake Dr
- 3831 Northlake Dr
- 3822 Northlake Dr
- 3820 Northlake Dr
- 3824 Northlake Dr
- 3811 Northlake Dr
- 3828 Northlake Dr
- 3816 Northlake Dr
- 3809 Northlake Dr
- 3812 Northlake Dr
- 3807 Northlake Dr
- 3810 Northlake Dr
- 302 N Waters Edge Dr
- 302 N Water's Edge Dr
- 3805 Northlake Dr
- 3808 Northlake Dr