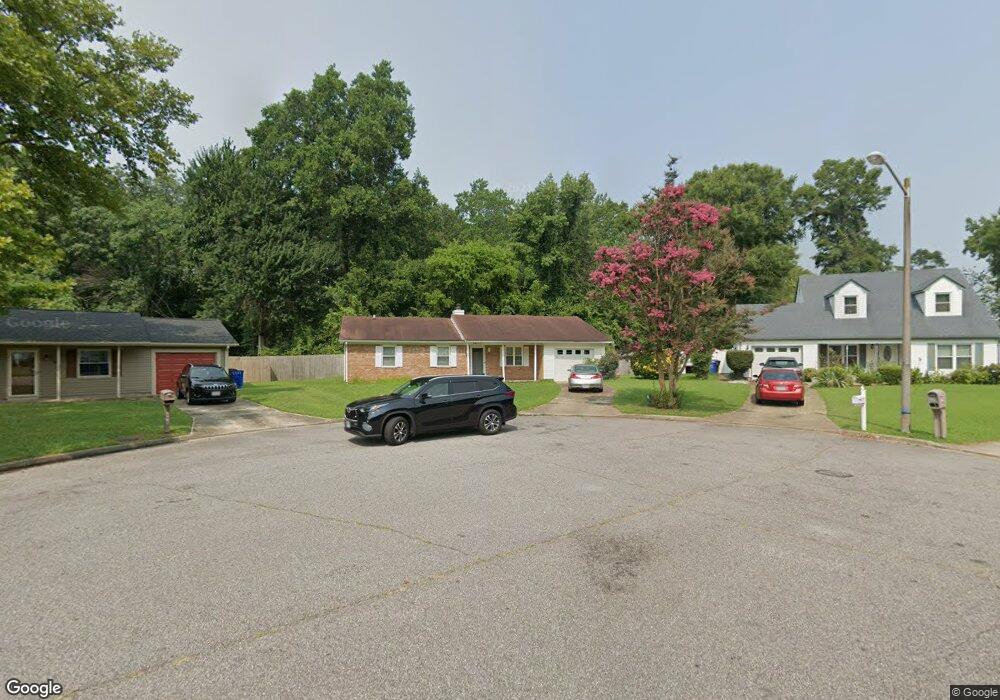
3821 Springbloom Dr Portsmouth, VA 23703
Churchland NeighborhoodEstimated Value: $253,000 - $275,361
4
Beds
2
Baths
1,412
Sq Ft
$186/Sq Ft
Est. Value
About This Home
This home is located at 3821 Springbloom Dr, Portsmouth, VA 23703 and is currently estimated at $263,090, approximately $186 per square foot. 3821 Springbloom Dr is a home located in Portsmouth City with nearby schools including Churchland Primary/Intermediate School, Churchland Middle School, and Churchland High School.
Ownership History
Date
Name
Owned For
Owner Type
Purchase Details
Closed on
Jun 12, 2018
Sold by
Manning Andre Lee and Manning Melanie E
Bought by
Fimbres Jessus D and Fimbres Eli M
Current Estimated Value
Home Financials for this Owner
Home Financials are based on the most recent Mortgage that was taken out on this home.
Original Mortgage
$148,117
Outstanding Balance
$128,383
Interest Rate
4.6%
Mortgage Type
VA
Estimated Equity
$134,707
Purchase Details
Closed on
Mar 26, 2009
Sold by
Springbloom Drive Trust
Bought by
Manning Andre Lee
Home Financials for this Owner
Home Financials are based on the most recent Mortgage that was taken out on this home.
Original Mortgage
$170,848
Interest Rate
5.02%
Mortgage Type
FHA
Purchase Details
Closed on
Jun 11, 2004
Sold by
Varen Mike
Bought by
Springbloom Drive Trust
Purchase Details
Closed on
Mar 10, 2000
Sold by
Small Colin M
Bought by
Varen Mike R
Home Financials for this Owner
Home Financials are based on the most recent Mortgage that was taken out on this home.
Original Mortgage
$76,900
Interest Rate
8.21%
Create a Home Valuation Report for This Property
The Home Valuation Report is an in-depth analysis detailing your home's value as well as a comparison with similar homes in the area
Home Values in the Area
Average Home Value in this Area
Purchase History
| Date | Buyer | Sale Price | Title Company |
|---|---|---|---|
| Fimbres Jessus D | $145,000 | Tqhr Llc | |
| Manning Andre Lee | $175,400 | -- | |
| Springbloom Drive Trust | $79,041 | -- | |
| Varen Mike R | $75,000 | -- |
Source: Public Records
Mortgage History
| Date | Status | Borrower | Loan Amount |
|---|---|---|---|
| Open | Fimbres Jessus D | $148,117 | |
| Previous Owner | Manning Andre Lee | $170,848 | |
| Previous Owner | Varen Mike R | $76,900 |
Source: Public Records
Tax History Compared to Growth
Tax History
| Year | Tax Paid | Tax Assessment Tax Assessment Total Assessment is a certain percentage of the fair market value that is determined by local assessors to be the total taxable value of land and additions on the property. | Land | Improvement |
|---|---|---|---|---|
| 2025 | $2,863 | $237,250 | $70,730 | $166,520 |
| 2024 | $2,863 | $232,780 | $70,730 | $162,050 |
| 2023 | $2,630 | $210,430 | $70,730 | $139,700 |
| 2022 | $2,481 | $190,810 | $58,940 | $131,870 |
| 2021 | $2,237 | $172,050 | $49,120 | $122,930 |
| 2020 | $2,134 | $164,130 | $46,780 | $117,350 |
| 2019 | $2,061 | $158,540 | $46,780 | $111,760 |
| 2018 | $2,003 | $154,070 | $46,780 | $107,290 |
| 2017 | $1,974 | $151,830 | $46,780 | $105,050 |
| 2016 | $1,945 | $149,600 | $46,780 | $102,820 |
| 2015 | $1,916 | $147,360 | $46,780 | $100,580 |
| 2014 | $1,871 | $147,360 | $46,780 | $100,580 |
Source: Public Records
Map
Nearby Homes
- 3817 Harvest Ct
- 3913 Stateflower Ct
- 3715 Magnolia Dr
- 3705 Bamboo Rd
- 3791 Towne Point Rd
- 3877 Peachtree Ln W
- 3818 Peach Orchard Cir
- 3866 Augustine Cir
- 3660B Towne Point Rd Unit A
- 3860 Sugar Creek Cir
- 3836 Old Farm Rd
- 6109 Compton Ct
- 6417 Pelican Crescent N
- 6446 Olde Bullocks Cir
- 8110 Lee Hall Ave
- 206 Rockwood Place
- 5226 Moreland St
- 17 Shoal Ct
- 6215 Cambridge Dr
- 4071 Long Point Blvd
- 3819 Springbloom Dr
- 3823 Springbloom Dr
- 3817 Springbloom Dr
- 3822 Springbloom Dr
- 3824 Springbloom Dr
- 3820 Springbloom Dr
- 3804 Stateflower Ct
- 3818 Springbloom Dr
- 3806 Stateflower Ct
- 3808 Stateflower Ct
- 3816 Springbloom Dr
- 3802 Stateflower Ct
- 3814 Springbloom Dr
- 3810 Stateflower Ct
- 3811 Greenleaf Trail
- 3800 Stateflower Ct
- 3807 Stateflower Ct
- 3809 Stateflower Ct
- 3812 Stateflower Ct
- 3805 Stateflower Ct