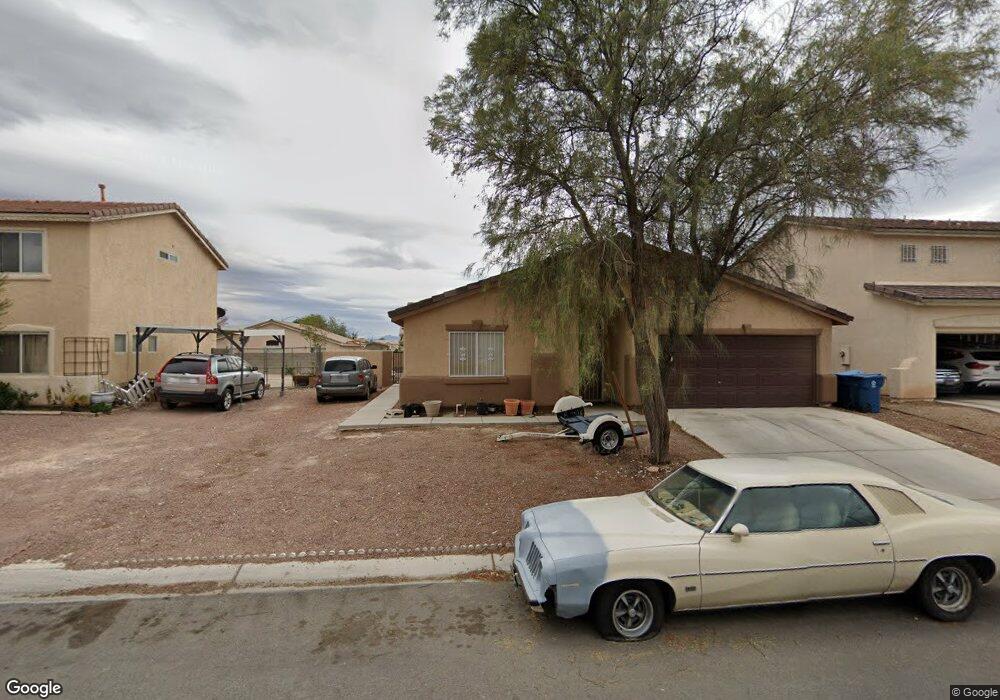
3821 Walnut Bend Ave Unit 3 Las Vegas, NV 89115
Estimated Value: $262,000 - $350,000
3
Beds
2
Baths
1,275
Sq Ft
$254/Sq Ft
Est. Value
About This Home
This home is located at 3821 Walnut Bend Ave Unit 3, Las Vegas, NV 89115 and is currently estimated at $323,907, approximately $254 per square foot. 3821 Walnut Bend Ave Unit 3 is a home located in Clark County with nearby schools including Clyde C. Cox Elementary School, Gwendolyn Woolley Elementary School, and Marvin M Sedway Middle School.
Ownership History
Date
Name
Owned For
Owner Type
Purchase Details
Closed on
May 6, 2011
Sold by
Machuca Flores Jose
Bought by
Machuca Ofelia M
Current Estimated Value
Home Financials for this Owner
Home Financials are based on the most recent Mortgage that was taken out on this home.
Original Mortgage
$68,225
Outstanding Balance
$47,326
Interest Rate
4.84%
Mortgage Type
FHA
Estimated Equity
$276,581
Purchase Details
Closed on
Oct 5, 2010
Sold by
Lopez Jose L and Lopez Noemi
Bought by
Federal National Mortgage Association
Purchase Details
Closed on
Nov 3, 2005
Sold by
Dixon Jonie
Bought by
Lopez Jose L and Lopez Noemi
Home Financials for this Owner
Home Financials are based on the most recent Mortgage that was taken out on this home.
Original Mortgage
$183,200
Interest Rate
6.5%
Mortgage Type
New Conventional
Purchase Details
Closed on
Mar 28, 2001
Sold by
Capital Pacific Holdings Llc
Bought by
Dixon Jonie
Home Financials for this Owner
Home Financials are based on the most recent Mortgage that was taken out on this home.
Original Mortgage
$103,700
Interest Rate
7.06%
Create a Home Valuation Report for This Property
The Home Valuation Report is an in-depth analysis detailing your home's value as well as a comparison with similar homes in the area
Home Values in the Area
Average Home Value in this Area
Purchase History
| Date | Buyer | Sale Price | Title Company |
|---|---|---|---|
| Machuca Ofelia M | $70,000 | Lawyers Title Of Nevada Hen | |
| Machuca Ofelia M | $70,000 | Lawyers Title Of Nevada Hen | |
| Federal National Mortgage Association | $197,742 | Accommodation | |
| Lopez Jose L | $230,000 | Lawyers Title Of Nevada | |
| Dixon Jonie | $115,240 | Nevada Title Company |
Source: Public Records
Mortgage History
| Date | Status | Borrower | Loan Amount |
|---|---|---|---|
| Open | Machuca Ofelia M | $68,225 | |
| Previous Owner | Lopez Jose L | $183,200 | |
| Previous Owner | Dixon Jonie | $103,700 |
Source: Public Records
Tax History Compared to Growth
Tax History
| Year | Tax Paid | Tax Assessment Tax Assessment Total Assessment is a certain percentage of the fair market value that is determined by local assessors to be the total taxable value of land and additions on the property. | Land | Improvement |
|---|---|---|---|---|
| 2025 | $1,165 | $77,607 | $25,900 | $51,707 |
| 2024 | $1,079 | $77,607 | $25,900 | $51,707 |
| 2023 | $718 | $76,768 | $28,000 | $48,768 |
| 2022 | $1,000 | $67,385 | $22,750 | $44,635 |
| 2021 | $926 | $63,350 | $21,000 | $42,350 |
| 2020 | $857 | $62,010 | $19,950 | $42,060 |
| 2019 | $803 | $56,896 | $15,400 | $41,496 |
| 2018 | $766 | $51,744 | $11,900 | $39,844 |
| 2017 | $1,489 | $50,775 | $10,500 | $40,275 |
| 2016 | $718 | $39,081 | $8,400 | $30,681 |
| 2015 | $716 | $33,115 | $5,600 | $27,515 |
| 2014 | $695 | $22,985 | $3,850 | $19,135 |
Source: Public Records
Map
Nearby Homes
- 3711 Lone Oak St
- 3711 Southern Light Dr
- 3829 Northern Light Dr
- 3915 Eblick Wash Dr
- 3975 Eblick Wash Dr
- 4052 Rocky Beach Dr
- 3726 Glow Dr
- 4064 Rocky Beach Dr
- 3747 Gulliver St
- 3923 Via Lucia Dr
- 3630 Three Bars Ct
- 4199 Dobson Dr
- 4211 Dobson Dr
- 3540 Purdue
- 4232 Heller Dr
- 4024 Edwin Place
- 3796 Steinbeck Dr
- 4102 Wendy Ln
- 3736 Steinbeck Dr
- 3883 Lancome St
- 3813 Walnut Bend Ave
- 3831 Walnut Bend Ave
- 3822 King Palm Ave
- 3812 King Palm Ave
- 3832 King Palm Ave Unit none
- 3832 King Palm Ave
- 3805 Walnut Bend Ave
- 3841 Walnut Bend Ave
- 3841 Walnut Bend Ave Unit none
- 3822 Walnut Bend Ave
- 3830 Walnut Bend Ave
- 3814 Walnut Bend Ave
- 3802 King Palm Ave
- 3842 King Palm Ave
- 3838 Walnut Bend Ave
- 3797 Walnut Bend Ave
- 3851 Walnut Bend Ave
- 3792 King Palm Ave
- 3846 Walnut Bend Ave
- 3852 King Palm Ave