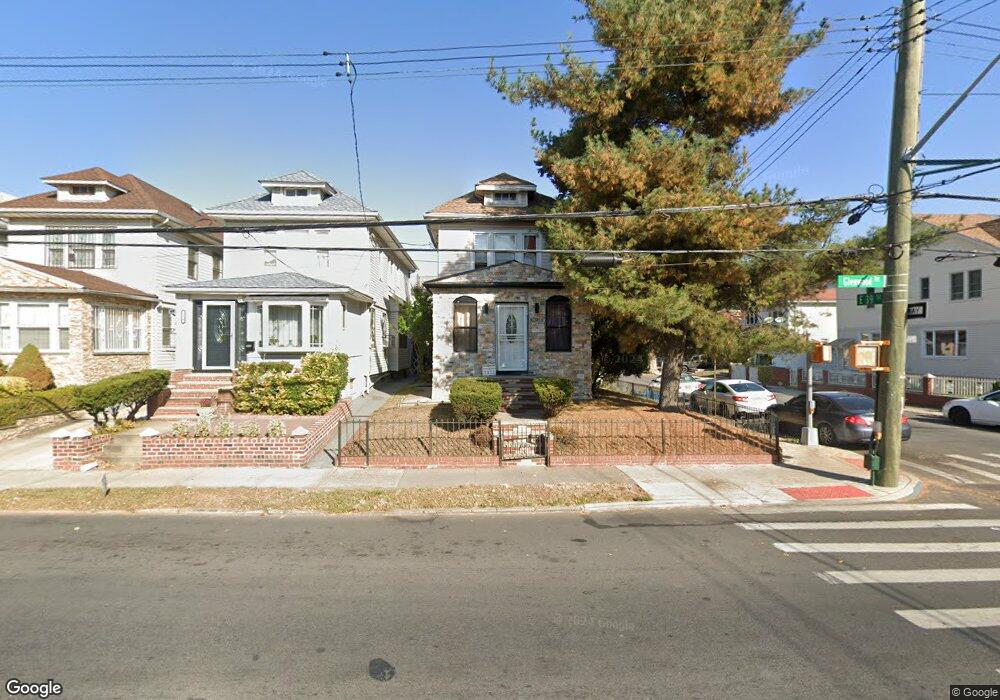
3823 Glenwood Rd Brooklyn, NY 11210
East Flatbush NeighborhoodEstimated Value: $716,976 - $860,000
--
Bed
--
Bath
1,402
Sq Ft
$547/Sq Ft
Est. Value
About This Home
This home is located at 3823 Glenwood Rd, Brooklyn, NY 11210 and is currently estimated at $766,994, approximately $547 per square foot. 3823 Glenwood Rd is a home located in Kings County with nearby schools including P.S. 198 Brooklyn, Andries Hudde School, and Central Brooklyn Ascend Charter.
Ownership History
Date
Name
Owned For
Owner Type
Purchase Details
Closed on
Jun 30, 2017
Sold by
Jacquet Denis
Bought by
Jacquet Denis P and Jacquet Marthing
Current Estimated Value
Home Financials for this Owner
Home Financials are based on the most recent Mortgage that was taken out on this home.
Original Mortgage
$371,387
Interest Rate
3.96%
Mortgage Type
New Conventional
Purchase Details
Closed on
Apr 15, 2015
Sold by
Jacquet Denis and Pierre Marie
Bought by
Jacquet Denis
Purchase Details
Closed on
Jun 23, 2003
Sold by
Aguste Carlos and Jacquet Denis
Bought by
Jacquet Denis and Pierre Marie
Purchase Details
Closed on
Nov 25, 1998
Sold by
Lagauerre Jean K and Lagauerre Roseline B
Bought by
Pierre Marie and Jacquet Denis
Home Financials for this Owner
Home Financials are based on the most recent Mortgage that was taken out on this home.
Original Mortgage
$171,250
Interest Rate
6.78%
Mortgage Type
FHA
Create a Home Valuation Report for This Property
The Home Valuation Report is an in-depth analysis detailing your home's value as well as a comparison with similar homes in the area
Home Values in the Area
Average Home Value in this Area
Purchase History
| Date | Buyer | Sale Price | Title Company |
|---|---|---|---|
| Jacquet Denis P | -- | -- | |
| Jacquet Denis P | -- | -- | |
| Jacquet Denis | -- | -- | |
| Jacquet Denis | -- | -- | |
| Jacquet Denis | -- | -- | |
| Jacquet Denis | -- | -- | |
| Pierre Marie | $172,000 | Chicago Title Insurance Co | |
| Pierre Marie | $172,000 | Chicago Title Insurance Co |
Source: Public Records
Mortgage History
| Date | Status | Borrower | Loan Amount |
|---|---|---|---|
| Previous Owner | Jacquet Denis P | $371,387 | |
| Previous Owner | Pierre Marie | $171,250 | |
| Closed | Jacquet Denis | $0 |
Source: Public Records
Tax History Compared to Growth
Tax History
| Year | Tax Paid | Tax Assessment Tax Assessment Total Assessment is a certain percentage of the fair market value that is determined by local assessors to be the total taxable value of land and additions on the property. | Land | Improvement |
|---|---|---|---|---|
| 2025 | $6,088 | $45,600 | $13,320 | $32,280 |
| 2024 | $6,088 | $43,860 | $13,320 | $30,540 |
| 2023 | $5,822 | $53,820 | $13,320 | $40,500 |
| 2022 | $5,441 | $44,880 | $13,320 | $31,560 |
| 2021 | $5,401 | $37,740 | $13,320 | $24,420 |
| 2020 | $2,624 | $35,940 | $13,320 | $22,620 |
| 2019 | $5,235 | $38,940 | $13,320 | $25,620 |
| 2018 | $4,810 | $25,056 | $10,169 | $14,887 |
| 2017 | $4,575 | $23,911 | $10,638 | $13,273 |
| 2016 | $4,200 | $22,560 | $10,888 | $11,672 |
| 2015 | $2,501 | $22,080 | $14,820 | $7,260 |
| 2014 | $2,501 | $22,020 | $14,820 | $7,200 |
Source: Public Records
Map
Nearby Homes
- 881 E 39th St
- 786 E 40th St
- 3816 Glenwood Rd
- 4002 Glenwood Rd
- 954 E 39th St
- 712 E 40th St
- 3521 Glenwood Rd
- 956 E 37th St
- 1604 Brooklyn Ave
- 775 E 37th St
- 677 E 38th St
- 664 E 42nd St
- 720 Brooklyn Ave Unit 5K
- 1681 Brooklyn Ave
- 890 E 34th St
- 785 E 34th St Unit 3-C
- 1390 Troy Ave
- 953 E 42nd St
- 944 E 45th St
- 1065 E 39th St
- 3819 Glenwood Rd
- 3817 Glenwood Rd
- 906 E 39th St
- 3815 Glenwood Rd
- 3901 Glenwood Rd
- 3811 Glenwood Rd
- 902 E 39th St
- 3903 Glenwood Rd
- 3807 Glenwood Rd
- 898 E 39th St
- 905 E 39th St
- 3905 Glenwood Rd
- 903 E 39th St
- 3803 Glenwood Rd
- 837 E 38th St
- 835 E 38th St
- 894 E 39th St
- 901 E 39th St
- 833 E 38th St
- 899 E 39th St