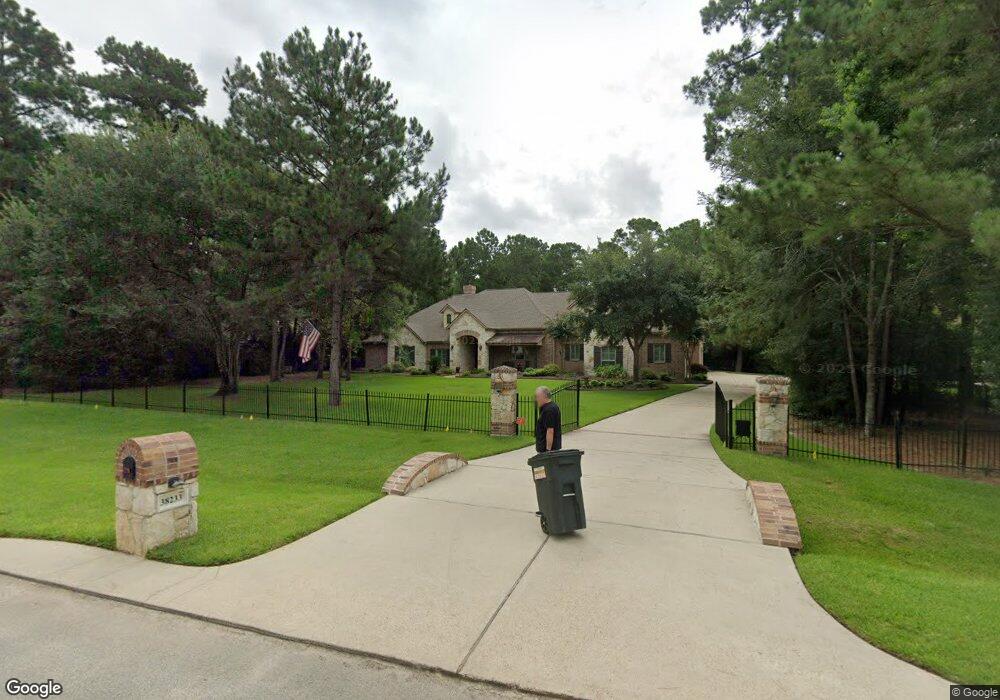
38233 Windy Ridge Trail Magnolia, TX 77355
Estimated Value: $895,595 - $1,163,000
--
Bed
1
Bath
3,860
Sq Ft
$253/Sq Ft
Est. Value
About This Home
This home is located at 38233 Windy Ridge Trail, Magnolia, TX 77355 and is currently estimated at $978,399, approximately $253 per square foot. 38233 Windy Ridge Trail is a home with nearby schools including Magnolia Elementary School, Magnolia Sixth Grade Campus, and Magnolia Junior High School.
Ownership History
Date
Name
Owned For
Owner Type
Purchase Details
Closed on
Jul 28, 2011
Sold by
Al Laham Maha
Bought by
Peurifoy Charles K and Peurifoy Gail S
Current Estimated Value
Home Financials for this Owner
Home Financials are based on the most recent Mortgage that was taken out on this home.
Original Mortgage
$85,200
Outstanding Balance
$58,881
Interest Rate
4.53%
Mortgage Type
Purchase Money Mortgage
Estimated Equity
$919,518
Purchase Details
Closed on
Apr 28, 2011
Sold by
Ghazal Adam Cassey and Agha Fadwa I
Bought by
Al Laham Maha
Purchase Details
Closed on
Dec 8, 2005
Sold by
Takechi Shinji
Bought by
Ghazal Adam Cassey and Agha Fadwa L
Purchase Details
Closed on
Apr 4, 2005
Sold by
Takechi Yuko
Bought by
Takechi Shinji
Purchase Details
Closed on
Dec 12, 2002
Sold by
Jack Frey Properties Inc
Bought by
Takechi Shinji and Takechi Yuko
Create a Home Valuation Report for This Property
The Home Valuation Report is an in-depth analysis detailing your home's value as well as a comparison with similar homes in the area
Home Values in the Area
Average Home Value in this Area
Purchase History
| Date | Buyer | Sale Price | Title Company |
|---|---|---|---|
| Peurifoy Charles K | -- | Stewart Title | |
| Al Laham Maha | -- | None Available | |
| Peurifoy Charles K | -- | -- | |
| Ghazal Adam Cassey | -- | Alamo Title Company | |
| Takechi Shinji | -- | -- | |
| Takechi Shinji | -- | Alamo Title Company |
Source: Public Records
Mortgage History
| Date | Status | Borrower | Loan Amount |
|---|---|---|---|
| Open | Peurifoy Charles K | $85,200 |
Source: Public Records
Tax History Compared to Growth
Tax History
| Year | Tax Paid | Tax Assessment Tax Assessment Total Assessment is a certain percentage of the fair market value that is determined by local assessors to be the total taxable value of land and additions on the property. | Land | Improvement |
|---|---|---|---|---|
| 2025 | $7,290 | $771,992 | -- | -- |
| 2024 | $6,999 | $701,811 | -- | -- |
| 2023 | $6,999 | $638,010 | $192,500 | $531,820 |
| 2022 | $10,235 | $580,010 | $130,300 | $582,350 |
| 2021 | $9,801 | $527,280 | $126,500 | $400,780 |
| 2020 | $12,019 | $593,920 | $126,500 | $467,420 |
| 2019 | $11,043 | $548,340 | $126,500 | $421,840 |
| 2018 | $9,222 | $498,840 | $77,000 | $421,840 |
| 2017 | $10,578 | $498,840 | $77,000 | $421,840 |
| 2016 | $11,017 | $519,560 | $77,000 | $442,560 |
| 2015 | $8,480 | $503,970 | $77,000 | $426,970 |
| 2014 | $8,480 | $405,360 | $77,000 | $348,140 |
Source: Public Records
Map
Nearby Homes
- TBD Fm 1774 Rd
- 28242 Forest Green Dr
- 28046 Crossway Oaks
- 28028 Crossway Oaks
- 29010 Legacy Ct
- TBD Legacy Ct
- 16715 Frosted Evergreen Ct
- 28322 Meadow Forest
- Resolution 3K Plan at Waterford Run - Clayton
- Colossal Plan at Waterford Run - Clayton
- The Jackson Plan at Waterford Run - Jessup
- Crazy Eights Plan at Waterford Run - Clayton
- 28915 Pine Forest Dr
- 18742 Mink Lake Dr
- 18631 Mink Lake Dr
- 37822 Windy Ridge Trail
- 42 Brookefield Cir
- 28208 Nichols Sawmill Rd
- 28915 Forest Hill Dr
- 18903 Veterans Rd
- 38243 Windy Ridge Trail
- Lot 17 Windy Ridge Trail
- Lot 12 Windy Ridge Trail
- 38153 Windy Ridge Trail
- 38232 Windy Ridge Trail
- 38262 Windy Ridge Trail
- 38142 Windy Ridge Trail
- 28113 Meadow Forest
- 28123 Meadow Forest
- 0 Bergman Dr Unit 82175444
- 0 Long Lake Unit 51127447
- 0 River Park Dr Unit 8154599
- 0 Sky Forest Cir Unit 8150702
- 0 River Park Dr Unit 885535
- 0 S Decker Unit 11774382
- 0 S Decker Unit 46414422
- 0 S Decker Unit 62001048
- 0 River Park Dr Unit 71991448
- 0 Bergman Dr Unit 46343544
- 0 Sky Forest Cir Unit 81862688