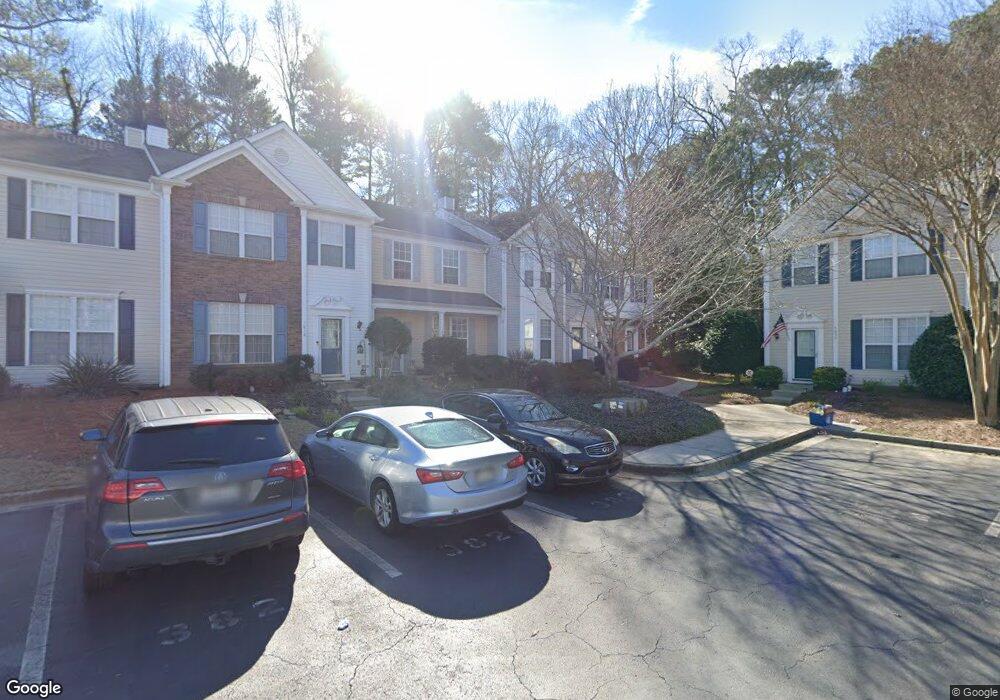
3824 Berkeley Crossing Duluth, GA 30096
Estimated Value: $256,000 - $283,000
2
Beds
3
Baths
1,260
Sq Ft
$215/Sq Ft
Est. Value
About This Home
This home is located at 3824 Berkeley Crossing, Duluth, GA 30096 and is currently estimated at $270,867, approximately $214 per square foot. 3824 Berkeley Crossing is a home located in Gwinnett County with nearby schools including Berkeley Lake Elementary School, Duluth Middle School, and Duluth High School.
Ownership History
Date
Name
Owned For
Owner Type
Purchase Details
Closed on
Oct 13, 2005
Sold by
Wang Lu and Wang Yan
Bought by
Cheek Jennifer K
Current Estimated Value
Home Financials for this Owner
Home Financials are based on the most recent Mortgage that was taken out on this home.
Original Mortgage
$103,200
Outstanding Balance
$54,386
Interest Rate
5.71%
Estimated Equity
$216,481
Purchase Details
Closed on
Jul 11, 2003
Sold by
Wang Lu
Bought by
Wang Lu and Wang Yan
Home Financials for this Owner
Home Financials are based on the most recent Mortgage that was taken out on this home.
Original Mortgage
$101,200
Interest Rate
5.17%
Purchase Details
Closed on
Feb 26, 1999
Sold by
Kakta Barbara Lynn Atkinson
Bought by
Ware Kelly D and Brainard Dwig
Home Financials for this Owner
Home Financials are based on the most recent Mortgage that was taken out on this home.
Original Mortgage
$101,200
Interest Rate
6.74%
Purchase Details
Closed on
Aug 28, 1997
Sold by
Canterbury Communities Inc
Bought by
Atkinson Barbara L
Create a Home Valuation Report for This Property
The Home Valuation Report is an in-depth analysis detailing your home's value as well as a comparison with similar homes in the area
Home Values in the Area
Average Home Value in this Area
Purchase History
| Date | Buyer | Sale Price | Title Company |
|---|---|---|---|
| Cheek Jennifer K | $129,000 | -- | |
| Wang Lu | -- | -- | |
| Wang Lu | $126,500 | -- | |
| Ware Kelly D | $110,500 | -- | |
| Atkinson Barbara L | $92,100 | -- |
Source: Public Records
Mortgage History
| Date | Status | Borrower | Loan Amount |
|---|---|---|---|
| Open | Cheek Jennifer K | $103,200 | |
| Previous Owner | Wang Lu | $101,200 | |
| Previous Owner | Ware Kelly D | $101,200 | |
| Closed | Atkinson Barbara L | -- |
Source: Public Records
Tax History
| Year | Tax Paid | Tax Assessment Tax Assessment Total Assessment is a certain percentage of the fair market value that is determined by local assessors to be the total taxable value of land and additions on the property. | Land | Improvement |
|---|---|---|---|---|
| 2025 | $753 | $108,080 | $18,040 | $90,040 |
| 2024 | $3,360 | $105,000 | $16,800 | $88,200 |
| 2023 | $3,360 | $105,000 | $16,800 | $88,200 |
| 2022 | $2,921 | $91,000 | $14,680 | $76,320 |
| 2021 | $2,341 | $71,360 | $14,680 | $56,680 |
| 2020 | $2,193 | $66,360 | $10,080 | $56,280 |
| 2019 | $2,489 | $62,200 | $9,200 | $53,000 |
| 2018 | $1,459 | $44,080 | $8,000 | $36,080 |
| 2016 | $1,458 | $44,080 | $8,000 | $36,080 |
| 2015 | $1,571 | $39,400 | $8,000 | $31,400 |
| 2014 | -- | $35,040 | $8,000 | $27,040 |
Source: Public Records
Map
Nearby Homes
- 3767 Berkeley Crossing
- 3752 Berkeley Crossing
- 4069 Howell Ferry Rd Unit 1
- 709 Berkeley Woods Dr
- 510 Berkeley Woods Dr
- 514 Berkeley Woods Dr
- 1003 Berkeley Woods Dr Unit 1003
- 3923 Meeting St
- 3929 Meeting St
- 3835 Meeting St
- 3865 Whitney Place
- 3692 Howell Wood Trail NW
- 3732 Whitney Place
- 4027 Wood Acres Ct
- 3801 Thayer Trace
- 3959 Saint Elisabeth Square
- 3786 Turnberry Ct
- 3967 Sweet Bottom Dr
- 3802 Greenwich Ave
- 3485 Parkbrooke Ln
- 3822 Berkeley Crossing
- 3826 Berkeley Crossing
- 3818 Berkeley Crossing
- 3818 Berkeley Crossing Unit 3818
- 3818 Berkeley Crossing Unit 32
- 3816 Berkeley Crossing Unit V
- 3832 Berkeley Crossing
- 3814 Berkeley Crossing
- 3834 Berkeley Crossing Unit 3834
- 3834 Berkeley Crossing
- 3834 Berkeley Crossing Unit 5
- 3812 Berkeley Crossing
- 3836 Berkeley Crossing
- 3838 Berkeley Crossing Unit 3838
- 3838 Berkeley Crossing
- 3842 Berkeley Crossing
- 3842 Berkeley Crossing Unit 3842
- 3806 Berkeley Crossing Unit 28
- 3806 Berkeley Crossing
- 3844 Berkeley Crossing
Your Personal Tour Guide
Ask me questions while you tour the home.