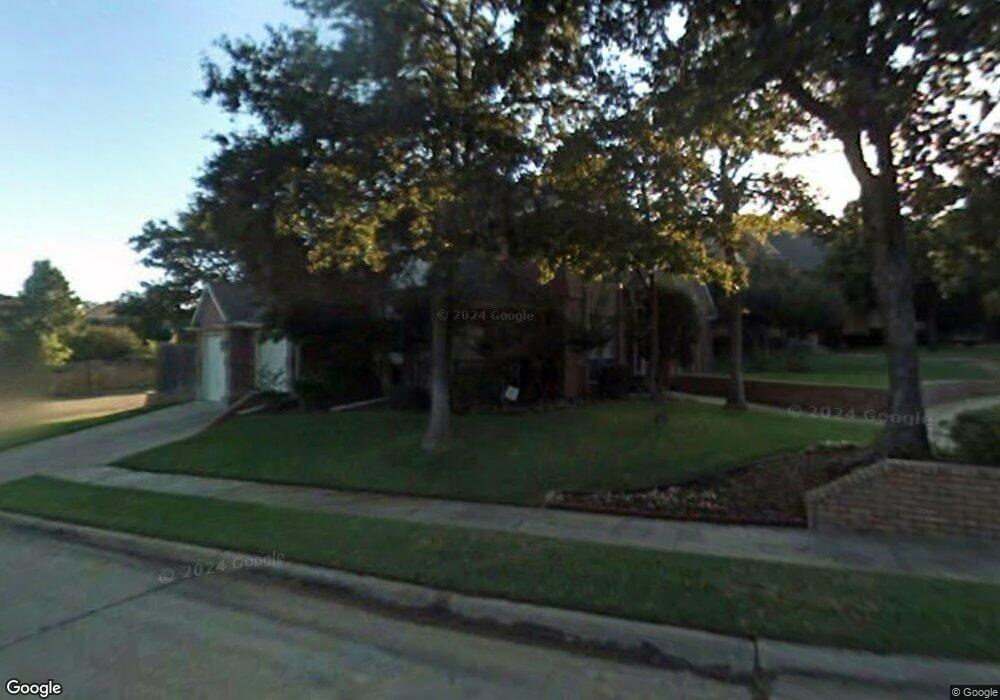
3824 Hillside Trail Grapevine, TX 76051
Estimated Value: $624,229 - $816,000
4
Beds
4
Baths
3,119
Sq Ft
$229/Sq Ft
Est. Value
About This Home
This home is located at 3824 Hillside Trail, Grapevine, TX 76051 and is currently estimated at $713,807, approximately $228 per square foot. 3824 Hillside Trail is a home located in Tarrant County with nearby schools including Heritage Elementary School, Cross Timbers Middle School, and Grapevine High School.
Ownership History
Date
Name
Owned For
Owner Type
Purchase Details
Closed on
Mar 31, 2015
Sold by
Sparacio Ruthann
Bought by
Flor Roberto
Current Estimated Value
Home Financials for this Owner
Home Financials are based on the most recent Mortgage that was taken out on this home.
Original Mortgage
$300,400
Outstanding Balance
$231,924
Interest Rate
3.82%
Mortgage Type
New Conventional
Estimated Equity
$481,883
Purchase Details
Closed on
Jun 14, 2002
Sold by
Smith Steve P and Smith Donna L
Bought by
Sparacio Ruthann
Home Financials for this Owner
Home Financials are based on the most recent Mortgage that was taken out on this home.
Original Mortgage
$237,500
Interest Rate
6.82%
Purchase Details
Closed on
Oct 31, 1994
Sold by
Waters Timothy A and Waters Patricia A
Bought by
Smith Steve P and Smith Donna L
Home Financials for this Owner
Home Financials are based on the most recent Mortgage that was taken out on this home.
Original Mortgage
$203,150
Interest Rate
8.73%
Create a Home Valuation Report for This Property
The Home Valuation Report is an in-depth analysis detailing your home's value as well as a comparison with similar homes in the area
Home Values in the Area
Average Home Value in this Area
Purchase History
| Date | Buyer | Sale Price | Title Company |
|---|---|---|---|
| Flor Roberto | -- | None Available | |
| Sparacio Ruthann | -- | Alamo Title Company | |
| Smith Steve P | -- | Trinity Western Title Co |
Source: Public Records
Mortgage History
| Date | Status | Borrower | Loan Amount |
|---|---|---|---|
| Open | Flor Roberto | $300,400 | |
| Previous Owner | Sparacio Ruthann | $237,500 | |
| Previous Owner | Smith Steve P | $203,150 |
Source: Public Records
Tax History Compared to Growth
Tax History
| Year | Tax Paid | Tax Assessment Tax Assessment Total Assessment is a certain percentage of the fair market value that is determined by local assessors to be the total taxable value of land and additions on the property. | Land | Improvement |
|---|---|---|---|---|
| 2025 | $2,098 | $518,000 | $98,250 | $419,750 |
| 2024 | $2,098 | $549,714 | $98,250 | $451,464 |
| 2023 | $7,853 | $603,784 | $98,250 | $505,534 |
| 2022 | $8,437 | $425,853 | $98,250 | $327,603 |
| 2021 | $9,259 | $425,853 | $58,950 | $366,903 |
| 2020 | $9,579 | $435,481 | $58,950 | $376,531 |
| 2019 | $10,089 | $442,398 | $100,000 | $342,398 |
| 2018 | $2,536 | $426,570 | $100,000 | $326,570 |
| 2017 | $9,295 | $401,925 | $80,000 | $321,925 |
| 2016 | $8,766 | $379,063 | $80,000 | $299,063 |
| 2015 | -- | $331,800 | $45,000 | $286,800 |
| 2014 | -- | $331,800 | $45,000 | $286,800 |
Source: Public Records
Map
Nearby Homes
- 2805 Pine View Dr
- 3826 Shady Meadow Dr
- 2669 Flameleaf Dr
- 3801 Hillside Trail
- 2849 Timber Hill Dr
- 3530 Quail Crest St
- 3602 Soft Wind Ct
- 2704 Yorkshire Ct
- 2126 Los Robles St
- 4105 Williams Ct
- 3601 William D Tate Ave
- 3904 Wagon Wheel Dr
- 1917 Waterford Dr
- 2831 Creekwood Ct
- 2841 West Ct
- 3107 Wintergreen Terrace
- 3223 Wintergreen Terrace
- 3110 Fox Run Dr
- 3206 Wintergreen Terrace
- 4157 Heartstone Dr
- 3822 Hillside Trail
- 2709 Shady Hill Ct
- 2757 Mesquite Ln
- 3820 Hillside Trail
- 2761 Mesquite Ln
- 2753 Mesquite Ln
- 3818 Hillside Trail
- 2707 Shady Hill Ct
- 2708 Shady Hill Ct
- 2765 Mesquite Ln
- 2749 Mesquite Ln
- 3816 Hillside Trail
- 2706 Shady Hill Ct
- 2705 Shady Hill Ct
- 2769 Mesquite Ln
- 2801 Highcrest Dr
- 2758 Mesquite Ln
- 2745 Mesquite Ln
- 2707 Wooded Trail Ct
- 2754 Mesquite Ln