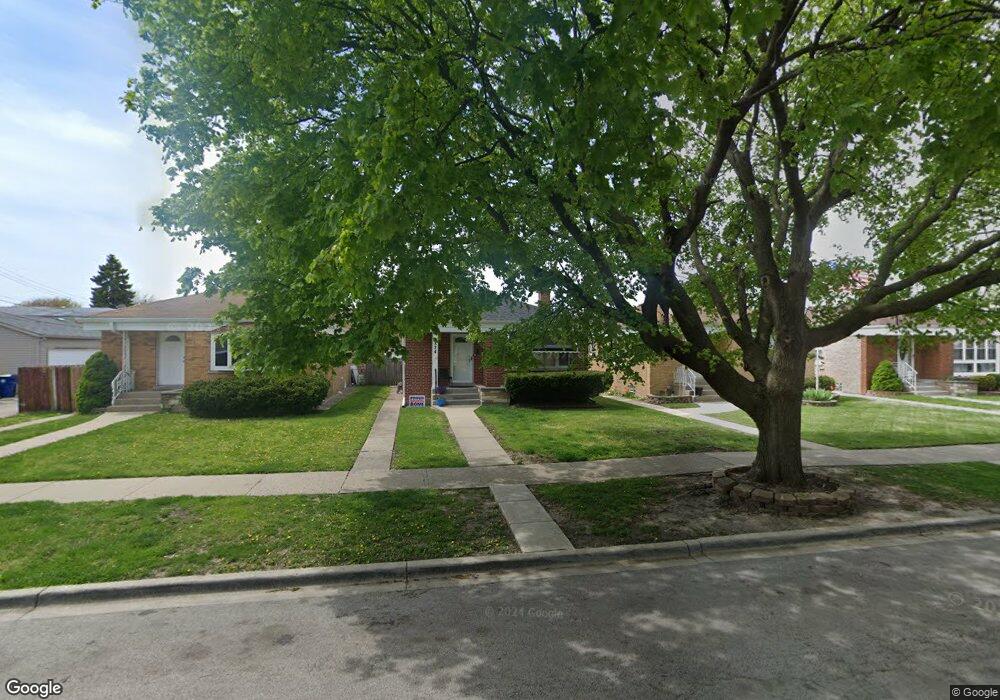
3824 S 60th Ct Cicero, IL 60804
Estimated Value: $285,830 - $297,000
3
Beds
1
Bath
948
Sq Ft
$306/Sq Ft
Est. Value
About This Home
This home is located at 3824 S 60th Ct, Cicero, IL 60804 and is currently estimated at $290,208, approximately $306 per square foot. 3824 S 60th Ct is a home located in Cook County with nearby schools including Abraham Lincoln Elementary School, Unity Jr High School, and J Sterling Morton Freshman Center.
Ownership History
Date
Name
Owned For
Owner Type
Purchase Details
Closed on
May 21, 2001
Sold by
Martinez Ramon and Martinez Maria Lourdes
Bought by
Bloodgood Michael
Current Estimated Value
Home Financials for this Owner
Home Financials are based on the most recent Mortgage that was taken out on this home.
Original Mortgage
$134,105
Outstanding Balance
$50,816
Interest Rate
7.23%
Mortgage Type
FHA
Estimated Equity
$239,392
Purchase Details
Closed on
Jun 19, 1998
Sold by
Garza Adrian
Bought by
Martinez Ramon and Martinez Maria Lourdes
Home Financials for this Owner
Home Financials are based on the most recent Mortgage that was taken out on this home.
Original Mortgage
$111,094
Interest Rate
7.15%
Mortgage Type
FHA
Purchase Details
Closed on
May 16, 1997
Sold by
Pelikan Anne
Bought by
Garza Adrian
Create a Home Valuation Report for This Property
The Home Valuation Report is an in-depth analysis detailing your home's value as well as a comparison with similar homes in the area
Home Values in the Area
Average Home Value in this Area
Purchase History
| Date | Buyer | Sale Price | Title Company |
|---|---|---|---|
| Bloodgood Michael | $136,000 | Chicago Title Insurance Co | |
| Martinez Ramon | $112,000 | Chicago Title Insurance Co | |
| Garza Adrian | $102,000 | -- |
Source: Public Records
Mortgage History
| Date | Status | Borrower | Loan Amount |
|---|---|---|---|
| Open | Bloodgood Michael | $134,105 | |
| Previous Owner | Martinez Ramon | $111,094 |
Source: Public Records
Tax History Compared to Growth
Tax History
| Year | Tax Paid | Tax Assessment Tax Assessment Total Assessment is a certain percentage of the fair market value that is determined by local assessors to be the total taxable value of land and additions on the property. | Land | Improvement |
|---|---|---|---|---|
| 2024 | $5,306 | $19,000 | $4,876 | $14,124 |
| 2023 | $6,284 | $19,000 | $4,876 | $14,124 |
| 2022 | $6,284 | $17,809 | $4,196 | $13,613 |
| 2021 | $6,250 | $17,808 | $4,195 | $13,613 |
| 2020 | $6,439 | $18,444 | $4,195 | $14,249 |
| 2019 | $4,469 | $12,589 | $3,855 | $8,734 |
| 2018 | $4,351 | $12,589 | $3,855 | $8,734 |
| 2017 | $4,216 | $12,589 | $3,855 | $8,734 |
| 2016 | $4,002 | $10,837 | $3,175 | $7,662 |
| 2015 | $3,895 | $10,837 | $3,175 | $7,662 |
| 2014 | $3,779 | $10,837 | $3,175 | $7,662 |
| 2013 | $4,734 | $14,085 | $3,175 | $10,910 |
Source: Public Records
Map
Nearby Homes
- 3744 S 59th Ct
- 3719 S Austin Blvd
- 3734 Lombard Ave
- 3744 S Harvey Ave
- 3736 S 58th Ave
- 3615 S 59th Ct
- 3703 S 58th Ct
- 3817 S 58th Ave
- 3610 Lombard Ave
- 3604 Lombard Ave
- 5728 W Pershing Rd
- 3816 Ridgeland Ave
- 3820 S 57th Ave
- 6421 Pershing Rd Unit 305
- 3633 S 57th Ct
- 3518 Harvey Ave
- 3933 Elmwood Ave
- 3733 S 57th Ave
- 3637 Elmwood Ave
- 3539 S 57th Ct
- 3822 S 60th Ct
- 3826 S 60th Ct
- 3820 S 60th Ct
- 3818 S 60th Ct
- 6040 W Pershing Rd
- 6038 W Pershing Rd
- 6036 W Pershing Rd
- 6042 W Pershing Rd
- 3859 S 61st Ave
- 3816 S 60th Ct
- 3857 S 61st Ave
- 3829 S 61st Ave
- 3821 S 61st Ave
- 3814 S 60th Ct
- 3825 S 60th Ct
- 3823 S 60th Ct
- 3827 S 60th Ct
- 3819 S 61st Ave
- 6046 W Pershing Rd
- 6046 W Pershing Rd Unit 4