3824 SW 3rd Ave Cape Coral, FL 33914
Pelican NeighborhoodEstimated Value: $328,000 - $381,000
3
Beds
2
Baths
2,152
Sq Ft
$164/Sq Ft
Est. Value
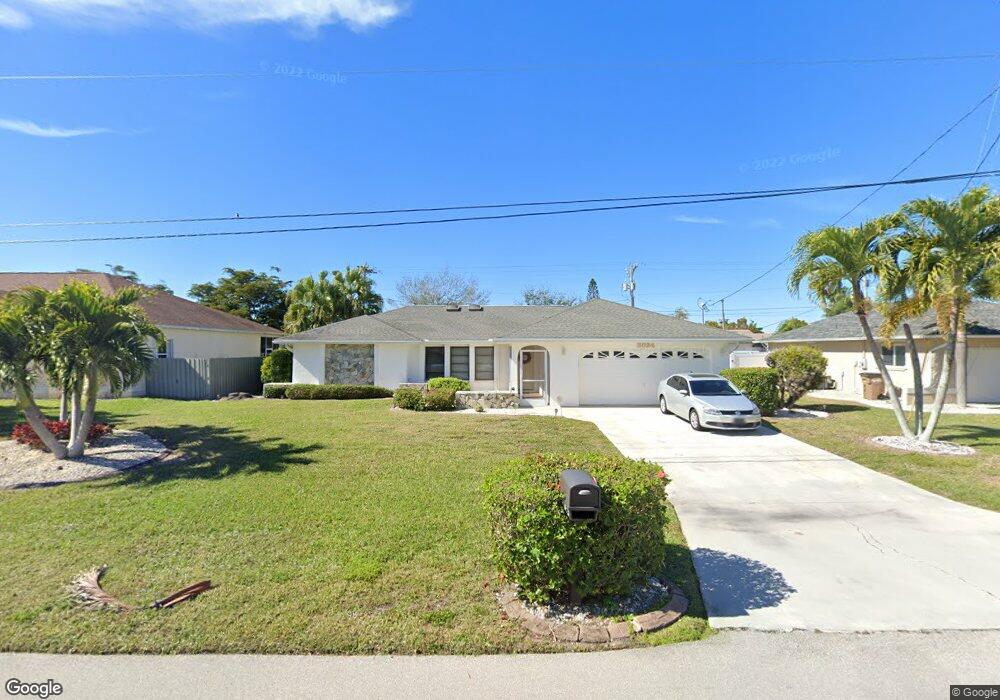
About This Home
This home is located at 3824 SW 3rd Ave, Cape Coral, FL 33914 and is currently estimated at $353,833, approximately $164 per square foot. 3824 SW 3rd Ave is a home located in Lee County with nearby schools including Cape Elementary School, Caloosa Elementary School, and Tropic Isles Elementary School.
Ownership History
Date
Name
Owned For
Owner Type
Purchase Details
Closed on
Mar 11, 2011
Sold by
Bellefeulle Rudy F
Bought by
Sambuco Richard and Sambuco Thomas
Current Estimated Value
Purchase Details
Closed on
May 28, 2010
Sold by
Edwards Gertrude J
Bought by
Sambuco Richard and Sambuco Thomas
Purchase Details
Closed on
Aug 19, 2005
Sold by
Lindsay John
Bought by
Edwards Gertrude J
Home Financials for this Owner
Home Financials are based on the most recent Mortgage that was taken out on this home.
Original Mortgage
$280,250
Interest Rate
8%
Mortgage Type
Unknown
Purchase Details
Closed on
Jun 11, 2003
Sold by
Gunning Patrick J and Gunning Sandra
Bought by
Lindsay John
Home Financials for this Owner
Home Financials are based on the most recent Mortgage that was taken out on this home.
Original Mortgage
$95,000
Interest Rate
5.56%
Mortgage Type
Purchase Money Mortgage
Create a Home Valuation Report for This Property
The Home Valuation Report is an in-depth analysis detailing your home's value as well as a comparison with similar homes in the area
Home Values in the Area
Average Home Value in this Area
Purchase History
| Date | Buyer | Sale Price | Title Company |
|---|---|---|---|
| Sambuco Richard | $33,300 | None Available | |
| Sambuco Richard | $99,900 | Towns Title & Co Inc | |
| Edwards Gertrude J | $295,000 | Title Professionals Of Fl | |
| Lindsay John | $143,000 | -- |
Source: Public Records
Mortgage History
| Date | Status | Borrower | Loan Amount |
|---|---|---|---|
| Previous Owner | Edwards Gertrude J | $280,250 | |
| Previous Owner | Lindsay John | $95,000 |
Source: Public Records
Tax History Compared to Growth
Tax History
| Year | Tax Paid | Tax Assessment Tax Assessment Total Assessment is a certain percentage of the fair market value that is determined by local assessors to be the total taxable value of land and additions on the property. | Land | Improvement |
|---|---|---|---|---|
| 2025 | $5,336 | $279,484 | $69,445 | $173,414 |
| 2024 | $5,101 | $269,183 | -- | -- |
| 2023 | $5,101 | $244,712 | $0 | $0 |
| 2022 | $4,559 | $222,465 | $0 | $0 |
| 2021 | $4,090 | $202,241 | $30,500 | $171,741 |
| 2020 | $3,890 | $184,116 | $27,300 | $156,816 |
| 2019 | $3,686 | $174,416 | $27,300 | $147,116 |
| 2018 | $3,783 | $176,032 | $26,000 | $150,032 |
| 2017 | $3,669 | $173,605 | $25,000 | $148,605 |
| 2016 | $3,402 | $159,929 | $25,000 | $134,929 |
| 2015 | $3,137 | $139,487 | $15,200 | $124,287 |
| 2014 | $2,904 | $126,110 | $11,800 | $114,310 |
| 2013 | -- | $116,900 | $9,800 | $107,100 |
Source: Public Records
Map
Nearby Homes
- 3931 Pelican Blvd
- 241 SW 40th St
- 213 SW 38th Terrace
- 3731 SW 3rd Ave
- 214 SW 39th Terrace
- 3916 SW 5th Ave
- 427 SW 40th Terrace
- 3806 SW 5th Ave
- 246 SW 37th St
- 141 SW 39th St
- 210 SW 37th Terrace
- 3915 SW 1st Place
- 3815 SW 6th Ave
- 3811 SW 6th Ave
- 3929 SW 1st Place
- 3906 SW 1st Ave
- 531 SW 40th Terrace
- 3733 SW 1st Place
- 607 SW 40th Terrace Unit 9
- 3632 SW 1st Place
- 3824 SW 3rd Ave
- 3820 SW 3rd Ave
- 3905 Pelican Blvd
- 3816 SW 3rd Ave
- 245 SW 39th St
- 3902 SW 3rd Ave
- 3823 Pelican Blvd
- 246 SW 38th Terrace
- 3909 Pelican Blvd
- 3812 SW 3rd Ave
- 3906 SW 3rd Ave
- 246 SW 39th St
- 241 SW 39th St
- 3819 Pelican Blvd
- 242 SW 38th Terrace
- 3808 SW 3rd Ave Unit 45
- 242 SW 39th St
- 245 SW 38th Terrace
- 3815 Pelican Blvd
- 237 SW 39th St