Estimated Value: $317,456 - $393,000
2
Beds
1
Bath
1,500
Sq Ft
$228/Sq Ft
Est. Value
About This Home
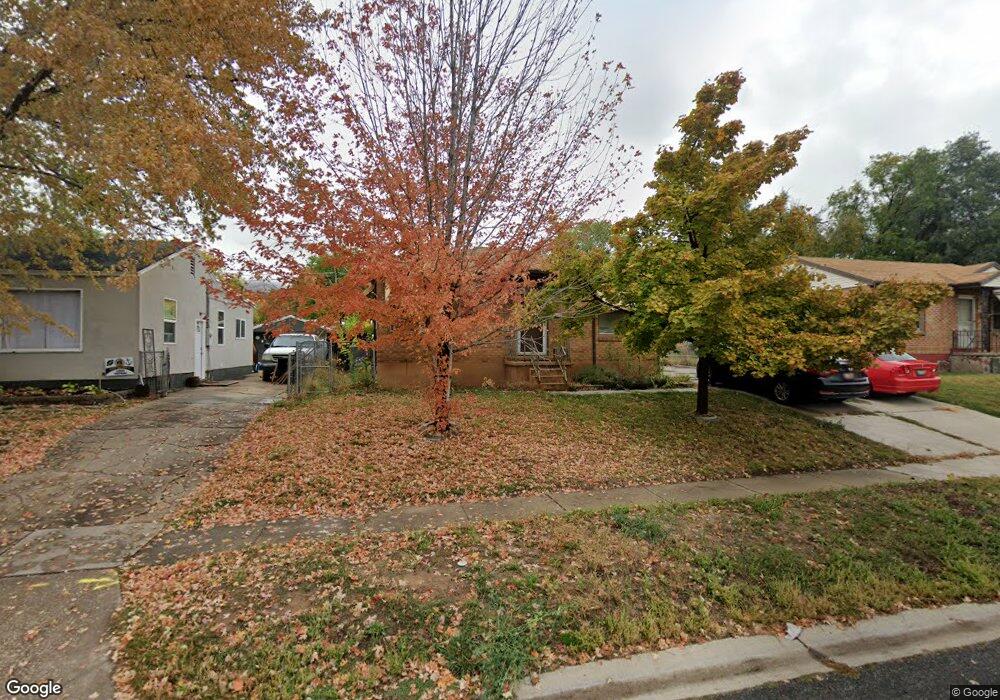
This home is located at 3826 Jefferson Ave, Ogden, UT 84403 and is currently estimated at $341,864, approximately $227 per square foot. 3826 Jefferson Ave is a home located in Weber County with nearby schools including Burch Creek School, South Ogden Junior High School, and Bonneville High School.
Ownership History
Date
Name
Owned For
Owner Type
Purchase Details
Closed on
Jun 6, 2011
Sold by
Straley Dawn R
Bought by
Huerta Isaac and Huerta Hannah
Current Estimated Value
Home Financials for this Owner
Home Financials are based on the most recent Mortgage that was taken out on this home.
Original Mortgage
$4,100
Outstanding Balance
$2,840
Interest Rate
4.73%
Mortgage Type
Stand Alone Second
Estimated Equity
$339,024
Purchase Details
Closed on
Jan 7, 1999
Sold by
Straley Dawn R and Clark Patricia A
Bought by
Straley Dawn R
Purchase Details
Closed on
Mar 28, 1996
Sold by
Shepard Doris B
Bought by
Straley Dawn R and Clark Patricia A
Home Financials for this Owner
Home Financials are based on the most recent Mortgage that was taken out on this home.
Original Mortgage
$65,860
Interest Rate
7.34%
Mortgage Type
FHA
Create a Home Valuation Report for This Property
The Home Valuation Report is an in-depth analysis detailing your home's value as well as a comparison with similar homes in the area
Home Values in the Area
Average Home Value in this Area
Purchase History
| Date | Buyer | Sale Price | Title Company |
|---|---|---|---|
| Huerta Isaac | -- | First American Builder Servi | |
| Straley Dawn R | -- | Backman Stewart Title | |
| Straley Dawn R | -- | -- |
Source: Public Records
Mortgage History
| Date | Status | Borrower | Loan Amount |
|---|---|---|---|
| Open | Huerta Isaac | $4,100 | |
| Open | Huerta Isaac | $92,493 | |
| Previous Owner | Straley Dawn R | $65,860 |
Source: Public Records
Tax History
| Year | Tax Paid | Tax Assessment Tax Assessment Total Assessment is a certain percentage of the fair market value that is determined by local assessors to be the total taxable value of land and additions on the property. | Land | Improvement |
|---|---|---|---|---|
| 2025 | $2,215 | $163,656 | $54,116 | $109,540 |
| 2024 | $2,068 | $156,199 | $54,116 | $102,083 |
| 2023 | $2,065 | $157,849 | $55,497 | $102,352 |
| 2022 | $2,011 | $158,950 | $44,626 | $114,324 |
| 2021 | $1,567 | $202,001 | $46,822 | $155,179 |
| 2020 | $1,478 | $177,000 | $37,270 | $139,730 |
| 2019 | $1,396 | $158,000 | $29,400 | $128,600 |
| 2018 | $1,281 | $136,000 | $29,400 | $106,600 |
| 2017 | $1,130 | $112,000 | $27,491 | $84,509 |
| 2016 | $1,050 | $57,400 | $15,619 | $41,781 |
| 2015 | $1,064 | $57,402 | $15,619 | $41,783 |
| 2014 | $905 | $46,373 | $15,619 | $30,754 |
Source: Public Records
Map
Nearby Homes
- 3760 Jefferson Ave
- 3754 Porter Ave
- 719 Bel Mar Dr
- 668 37th St
- 3845 Nordin Ave
- 3658 Jefferson Ave
- 4013 Jefferson Ave
- 4014 Porter Ave
- 3683 Adams Ave
- 3925 S Evelyn Rd
- 3856 Grandview Dr
- 3567 Adams Ave
- 3555 Adams Ave
- 3878 Grandview Dr
- 3828 Quincy Ave
- 904 39th St
- 325 E Chimes View Cir
- 225 E 40th St S
- 302 40th St
- 4079 S 895 E Unit 67
- 3832 Jefferson Ave
- 3818 Jefferson Ave
- 3838 Jefferson Ave
- 3802 Jefferson Ave
- 3825 Orchard Ave
- 3811 Orchard Ave
- 643 38th St
- 3825 S Orchard E
- 3819 Jefferson Ave
- 3819 Jefferson Ave Unit 6
- 598 Leona Dr
- 3848 Jefferson Ave
- 3833 Orchard Ave
- 3801 Jefferson Ave
- 647 38th St
- 3815 Orchard Ave Unit 3815
- 630 38th St
- 3839 Orchard Ave
- 3849 Jefferson Ave
- 3854 Jefferson Ave
Your Personal Tour Guide
Ask me questions while you tour the home.