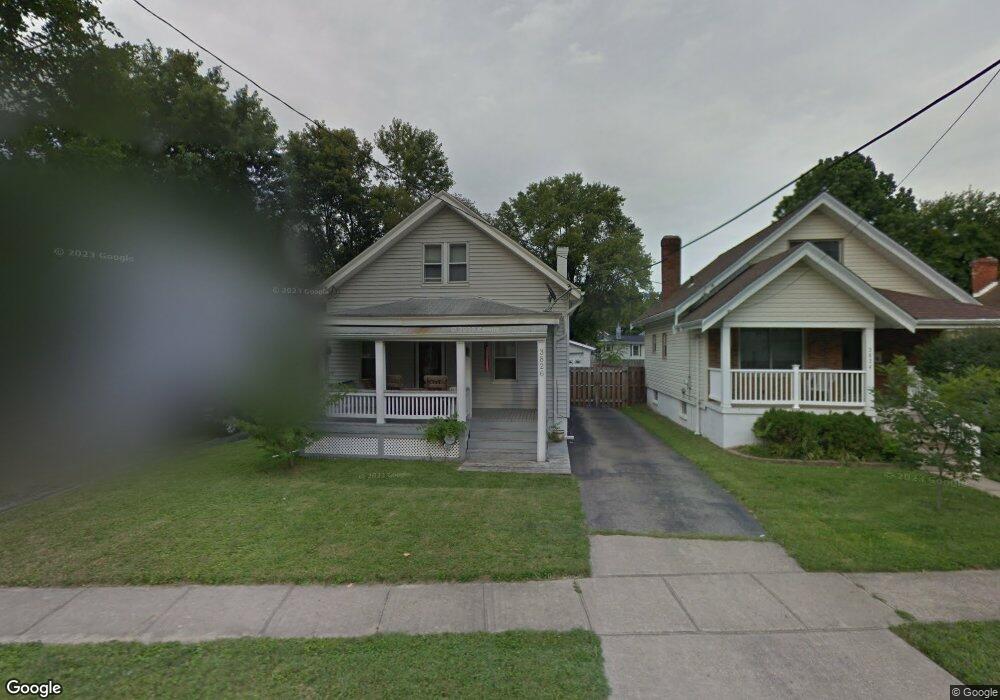
3826 Simpson Ave Cincinnati, OH 45227
Estimated Value: $258,000 - $324,000
3
Beds
1
Bath
1,296
Sq Ft
$227/Sq Ft
Est. Value
About This Home
This home is located at 3826 Simpson Ave, Cincinnati, OH 45227 and is currently estimated at $293,810, approximately $226 per square foot. 3826 Simpson Ave is a home located in Hamilton County with nearby schools including Terrace Park Elementary School, Mariemont Elementary School, and Mariemont Junior High School.
Ownership History
Date
Name
Owned For
Owner Type
Purchase Details
Closed on
Dec 7, 2018
Sold by
Schweitzer Ronald E and Schweitzer Katherine L
Bought by
Dougherty Patrick J and Dougherty Julie G
Current Estimated Value
Home Financials for this Owner
Home Financials are based on the most recent Mortgage that was taken out on this home.
Original Mortgage
$85,600
Outstanding Balance
$74,822
Interest Rate
4.8%
Mortgage Type
New Conventional
Estimated Equity
$218,988
Purchase Details
Closed on
Nov 20, 2017
Sold by
Estate Of Sherry L Frank
Bought by
Schweitzer Ronald E and Schweitzer Katherine L
Purchase Details
Closed on
Jun 15, 2007
Sold by
Knabb Walter W and Knabb Martha J
Bought by
Frank Sherry L
Home Financials for this Owner
Home Financials are based on the most recent Mortgage that was taken out on this home.
Original Mortgage
$111,200
Interest Rate
6.26%
Mortgage Type
Unknown
Create a Home Valuation Report for This Property
The Home Valuation Report is an in-depth analysis detailing your home's value as well as a comparison with similar homes in the area
Home Values in the Area
Average Home Value in this Area
Purchase History
| Date | Buyer | Sale Price | Title Company |
|---|---|---|---|
| Dougherty Patrick J | $107,000 | None Available | |
| Schweitzer Ronald E | -- | None Available | |
| Frank Sherry L | $139,000 | Advanced Land Title Agency |
Source: Public Records
Mortgage History
| Date | Status | Borrower | Loan Amount |
|---|---|---|---|
| Open | Dougherty Patrick J | $85,600 | |
| Previous Owner | Frank Sherry L | $111,200 |
Source: Public Records
Tax History
| Year | Tax Paid | Tax Assessment Tax Assessment Total Assessment is a certain percentage of the fair market value that is determined by local assessors to be the total taxable value of land and additions on the property. | Land | Improvement |
|---|---|---|---|---|
| 2025 | $4,516 | $60,127 | $20,136 | $39,991 |
| 2023 | $4,104 | $60,127 | $20,136 | $39,991 |
| 2022 | $3,088 | $37,451 | $10,812 | $26,639 |
| 2021 | $2,958 | $37,451 | $10,812 | $26,639 |
| 2020 | $2,984 | $37,451 | $10,812 | $26,639 |
| 2019 | $3,809 | $43,306 | $9,569 | $33,737 |
| 2018 | $3,722 | $43,306 | $9,569 | $33,737 |
| 2017 | $2,543 | $43,306 | $9,569 | $33,737 |
| 2016 | $2,241 | $38,059 | $9,562 | $28,497 |
| 2015 | $2,243 | $38,059 | $9,562 | $28,497 |
| 2014 | $2,251 | $38,059 | $9,562 | $28,497 |
| 2013 | $2,711 | $36,950 | $9,282 | $27,668 |
Source: Public Records
Map
Nearby Homes
- 6208 Bancroft St
- 3723 Carlton Ave
- 3715 Simpson Ave
- 3710 Watterson Rd
- 3910 Germania St
- 3645 Birkdale Ln
- 6307 Wooster Pike
- 3669 Birkdale Ln
- 3665 Birkdale Ln
- 3657 Birkdale Ln
- 3662 Birkdale Ln
- 3653 Birkdale Ln
- 3649 Birkdale Ln
- 3641 Birkdale Ln
- 4115 Homer Ave
- 6017 Bramble Ave
- 6613 Bramble Ave
- 5811 Bramble Ave
- 6007 Wooster Pike
- 5581 Nightingale Ct
- 3828 Simpson Ave
- 3832 Simpson Ave
- 3818 Simpson Ave
- 3827 Carlton St
- 3825 Carlton St
- 3823 Carlton St
- 3829 Carlton St
- 3825 Simpson Ave
- 3823 Carlton Ave
- 3821 Carlton St
- 6206 Elder St
- 3823 Simpson Ave
- 3821 Simpson Ave
- 3819 Carlton St
- 3827 Simpson Ave
- 3819 Simpson Ave
- 3829 Simpson Ave
- 3816 Simpson Ave
- 3816 Simpson Ave
- 3904 Simpson Ave
Your Personal Tour Guide
Ask me questions while you tour the home.