Estimated Value: $266,299 - $292,000
3
Beds
2
Baths
1,204
Sq Ft
$230/Sq Ft
Est. Value
About This Home
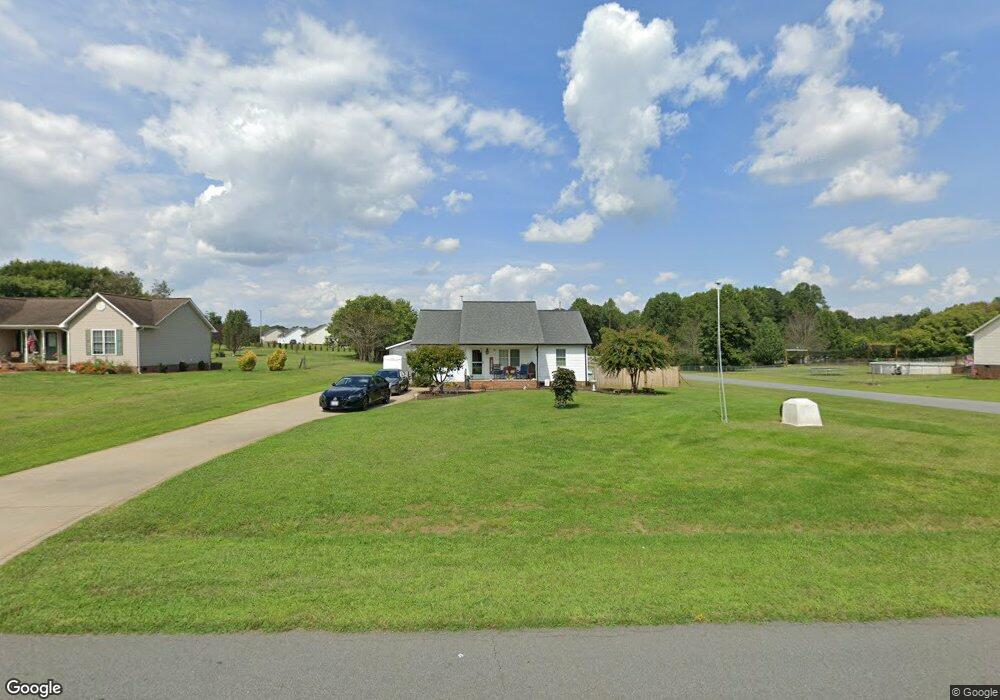
This home is located at 3826 Spike Ln, Vale, NC 28168 and is currently estimated at $276,325, approximately $229 per square foot. 3826 Spike Ln is a home located in Lincoln County with nearby schools including Union Elementary School, West Lincoln Middle, and West Lincoln High School.
Ownership History
Date
Name
Owned For
Owner Type
Purchase Details
Closed on
Jul 31, 2018
Sold by
Alley Jonathan D and Alley Savannah
Bought by
Walker Daniel Eugene and Walker Sylvia Jean
Current Estimated Value
Home Financials for this Owner
Home Financials are based on the most recent Mortgage that was taken out on this home.
Original Mortgage
$128,250
Outstanding Balance
$111,380
Interest Rate
4.5%
Mortgage Type
New Conventional
Estimated Equity
$164,945
Purchase Details
Closed on
Dec 21, 2016
Sold by
Newton Brian Scott
Bought by
Alley Jonathan D and Smith Savannah
Home Financials for this Owner
Home Financials are based on the most recent Mortgage that was taken out on this home.
Original Mortgage
$5,793
Interest Rate
3.57%
Mortgage Type
Purchase Money Mortgage
Purchase Details
Closed on
Aug 1, 2002
Bought by
Johnson Sherry A
Purchase Details
Closed on
Feb 4, 2002
Bought by
Maiden Wesleyan Church
Purchase Details
Closed on
Jan 13, 2000
Bought by
Dean Floyd and Stanley David E
Create a Home Valuation Report for This Property
The Home Valuation Report is an in-depth analysis detailing your home's value as well as a comparison with similar homes in the area
Home Values in the Area
Average Home Value in this Area
Purchase History
| Date | Buyer | Sale Price | Title Company |
|---|---|---|---|
| Walker Daniel Eugene | $135,000 | None Available | |
| Alley Jonathan D | $118,000 | Investors Title Gastonia | |
| Johnson Sherry A | $90,000 | -- | |
| Maiden Wesleyan Church | $9,000 | -- | |
| Dean Floyd | $294,800 | -- |
Source: Public Records
Mortgage History
| Date | Status | Borrower | Loan Amount |
|---|---|---|---|
| Open | Walker Daniel Eugene | $128,250 | |
| Previous Owner | Alley Jonathan D | $5,793 |
Source: Public Records
Tax History Compared to Growth
Tax History
| Year | Tax Paid | Tax Assessment Tax Assessment Total Assessment is a certain percentage of the fair market value that is determined by local assessors to be the total taxable value of land and additions on the property. | Land | Improvement |
|---|---|---|---|---|
| 2025 | $1,477 | $214,234 | $22,000 | $192,234 |
| 2024 | $1,457 | $214,234 | $22,000 | $192,234 |
| 2023 | $1,452 | $214,234 | $22,000 | $192,234 |
| 2022 | $1,054 | $126,196 | $21,000 | $105,196 |
| 2021 | $1,054 | $126,196 | $21,000 | $105,196 |
| 2020 | $914 | $126,196 | $21,000 | $105,196 |
| 2019 | $914 | $126,196 | $21,000 | $105,196 |
| 2018 | $840 | $100,409 | $18,500 | $81,909 |
| 2017 | $739 | $100,409 | $18,500 | $81,909 |
| 2016 | $704 | $100,409 | $18,500 | $81,909 |
| 2015 | $776 | $100,409 | $18,500 | $81,909 |
| 2014 | $785 | $104,418 | $19,000 | $85,418 |
Source: Public Records
Map
Nearby Homes
- 000 Flag Ln Unit 53
- 3817 Spike Ln
- 1643 Flag Ln
- 3637 Reepsville Rd
- 1983 Seagletown Rd
- 1551 J Rhyne Reep Rd
- 4318 Katie Reep Ln
- 3300 Paul Heavner Ln
- 142 Alf Hoover Rd
- 2614 Reepsville Rd
- 1259 Haywood Ct
- 2064 Colorado Ct
- 2508 Rock Dam Rd
- 2363 Reepsville Rd
- 5298 Hoover Elmore Rd
- 00 Wilson Ct Unit 15
- 00 Wilson Ct Unit 13
- 00 Wilson Ct Unit 12
- 3987 W Highway 27
- 3579 June Bug Rd
- 3826 Spike Ln Unit 29
- 3836 Spike Ln
- LOT 21 Spike Ln Unit 21
- 0 Spike Ln
- 3846 Spike Ln
- 1613 Flag Ln
- 3798 Spike Ln
- LOT 53 Flag Ln
- 4.26 Acres on Flag Ln Unit 48
- 3827 Spike Ln
- 3856 Spike Ln
- 3837 Spike Ln
- 3788 Spike Ln
- 1631 Flag Ln
- 1631 Flag Ln Unit 40
- 3805 Spike Ln
- 3847 Spike Ln
- 0000 Flag Ln Unit 53
- 0000 Flag Ln
- 1620 Flag Ln