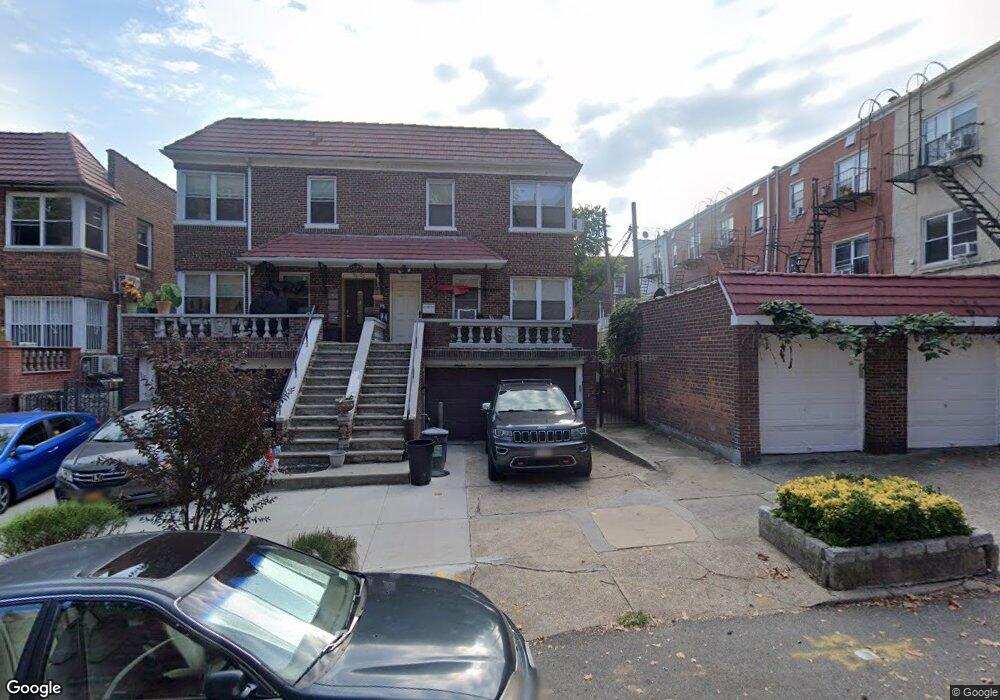
3827 52nd St Sunnyside, NY 11104
Woodside NeighborhoodEstimated Value: $1,182,000 - $1,812,000
--
Bed
--
Bath
2,150
Sq Ft
$742/Sq Ft
Est. Value
About This Home
This home is located at 3827 52nd St, Sunnyside, NY 11104 and is currently estimated at $1,594,314, approximately $741 per square foot. 3827 52nd St is a home located in Queens County with nearby schools including P.S. 11 Kathryn Phelan, William Cullen Bryant High School, and St Sebastian School.
Ownership History
Date
Name
Owned For
Owner Type
Purchase Details
Closed on
Jul 25, 2022
Sold by
Gianutsos Gerasimos
Bought by
Huang Billy and Zhang Min
Current Estimated Value
Home Financials for this Owner
Home Financials are based on the most recent Mortgage that was taken out on this home.
Original Mortgage
$1,040,000
Outstanding Balance
$994,041
Interest Rate
5.81%
Mortgage Type
Purchase Money Mortgage
Estimated Equity
$600,273
Purchase Details
Closed on
Nov 29, 2004
Sold by
Griscti Adrienne and Griscti Michael
Bought by
Gianutsos Gerasimos J
Home Financials for this Owner
Home Financials are based on the most recent Mortgage that was taken out on this home.
Original Mortgage
$300,000
Interest Rate
5.63%
Mortgage Type
Purchase Money Mortgage
Purchase Details
Closed on
Aug 11, 1997
Sold by
Frankini Arlene M and Morvay John E
Bought by
Neckland Gloria and Griscti Michael
Home Financials for this Owner
Home Financials are based on the most recent Mortgage that was taken out on this home.
Original Mortgage
$135,000
Interest Rate
7.47%
Create a Home Valuation Report for This Property
The Home Valuation Report is an in-depth analysis detailing your home's value as well as a comparison with similar homes in the area
Home Values in the Area
Average Home Value in this Area
Purchase History
| Date | Buyer | Sale Price | Title Company |
|---|---|---|---|
| Huang Billy | $1,600,000 | -- | |
| Huang Billy | $1,600,000 | -- | |
| Gianutsos Gerasimos J | $600,000 | -- | |
| Gianutsos Gerasimos J | $600,000 | -- | |
| Neckland Gloria | $127,000 | First American Title Ins Co | |
| Neckland Gloria | -- | Commonwealth Land Title Ins | |
| Neckland Gloria | $127,000 | First American Title Ins Co |
Source: Public Records
Mortgage History
| Date | Status | Borrower | Loan Amount |
|---|---|---|---|
| Open | Huang Billy | $1,040,000 | |
| Closed | Huang Billy | $1,040,000 | |
| Previous Owner | Gianutsos Gerasimos J | $300,000 | |
| Previous Owner | Neckland Gloria | $135,000 |
Source: Public Records
Tax History Compared to Growth
Tax History
| Year | Tax Paid | Tax Assessment Tax Assessment Total Assessment is a certain percentage of the fair market value that is determined by local assessors to be the total taxable value of land and additions on the property. | Land | Improvement |
|---|---|---|---|---|
| 2025 | $10,955 | $57,813 | $9,882 | $47,931 |
| 2024 | $10,955 | $54,541 | $9,674 | $44,867 |
| 2023 | $10,383 | $51,695 | $7,799 | $43,896 |
| 2022 | $9,736 | $72,120 | $12,420 | $59,700 |
| 2021 | $10,263 | $75,780 | $12,420 | $63,360 |
| 2020 | $10,198 | $75,420 | $12,420 | $63,000 |
| 2019 | $9,508 | $64,560 | $12,420 | $52,140 |
| 2018 | $8,782 | $43,079 | $7,563 | $35,516 |
| 2017 | $8,285 | $40,641 | $8,455 | $32,186 |
| 2016 | $8,125 | $40,641 | $8,455 | $32,186 |
| 2015 | $4,624 | $40,148 | $12,124 | $28,024 |
| 2014 | $4,624 | $37,876 | $10,483 | $27,393 |
Source: Public Records
Map
Nearby Homes
- 52-21 39th Rd Unit 2B
- 39-20 52nd St Unit 2G
- 39-20 52nd St Unit 4D
- 39-20 52nd St Unit 5E
- 3920 52nd St Unit 2g
- 3920 52nd St Unit 5E
- 39-30 52nd St Unit 6-E
- 39-30 52nd St Unit GA
- 39-30 52nd St Unit 4F
- 39-11 50th St
- 39-45 51st St Unit 1D
- 39-45 51st St Unit 5C
- 39-50 52nd St Unit 4E
- 39-50 52nd St Unit 1B
- 39-32 54th St
- 3965 52nd St Unit 5U
- 39-55 51st St Unit 4A
- 39-55 51st St Unit 6A
- 39-55 51st St Unit 3G
- 39-60 52nd St Unit 4G
- 3827 52nd St
- 3825 52nd St
- 3823 52nd St
- 38-23 52nd St
- 38-23 52nd St Unit Lower
- 39-60 52nd St Unit 2D
- 39-60 52nd St Unit 2E
- 52-03 39th Ave Unit 2fl
- 5205 39th Ave
- 5207 39th Ave
- 5203 39th Ave
- 5201 39th Ave
- 5209 39th Ave
- 3821 52nd St
- 52-09 39th Ave Unit 2nd FL
- 5215 39th Ave
- 3819 52nd St
- 5217 39th Ave
- 52-17 39th Ave