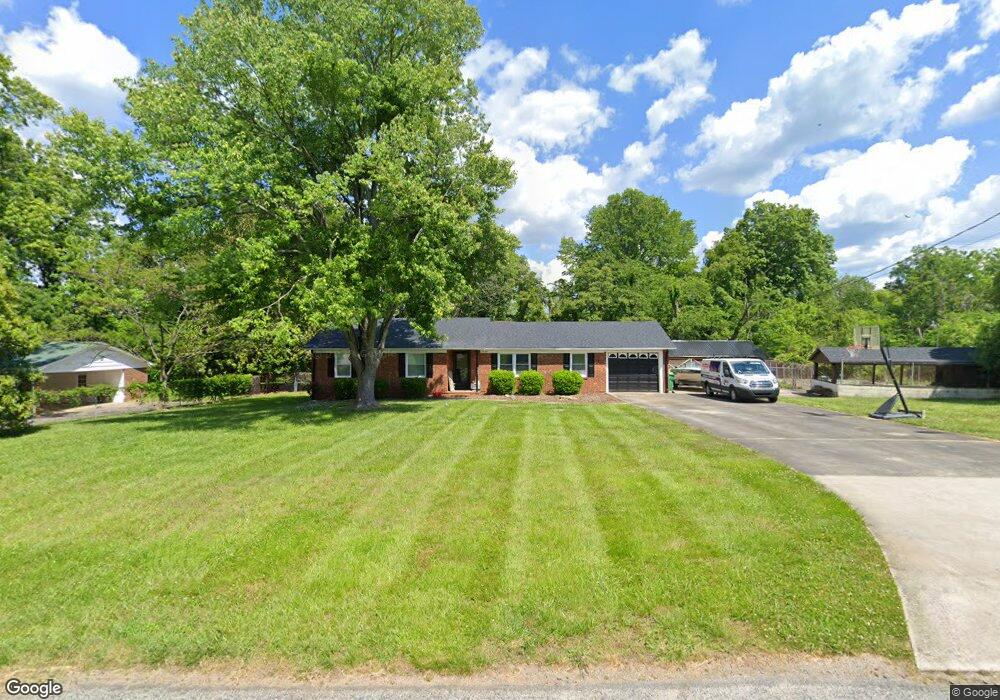
3828 Fox Meadow Rd Trinity, NC 27370
Estimated Value: $253,000 - $281,000
3
Beds
2
Baths
1,496
Sq Ft
$178/Sq Ft
Est. Value
About This Home
This home is located at 3828 Fox Meadow Rd, Trinity, NC 27370 and is currently estimated at $266,662, approximately $178 per square foot. 3828 Fox Meadow Rd is a home located in Randolph County with nearby schools including Hopewell Elementary School, Wheatmore Middle School, and Wheatmore High School.
Ownership History
Date
Name
Owned For
Owner Type
Purchase Details
Closed on
Apr 9, 2010
Sold by
Boone Harvey and Boone Carol
Bought by
Clinard Timothy L
Current Estimated Value
Home Financials for this Owner
Home Financials are based on the most recent Mortgage that was taken out on this home.
Original Mortgage
$97,171
Outstanding Balance
$65,266
Interest Rate
5.25%
Mortgage Type
FHA
Estimated Equity
$201,396
Purchase Details
Closed on
Apr 5, 2007
Sold by
Campbell Karen and Campbell Karen I
Bought by
Boone Harvey S and Boone Carol N
Home Financials for this Owner
Home Financials are based on the most recent Mortgage that was taken out on this home.
Original Mortgage
$146,697
Interest Rate
6.1%
Mortgage Type
FHA
Purchase Details
Closed on
Feb 8, 2004
Sold by
Campbell Bobby D
Bought by
Campbell Karen
Purchase Details
Closed on
Mar 24, 1994
Bought by
Clinard Timothy
Create a Home Valuation Report for This Property
The Home Valuation Report is an in-depth analysis detailing your home's value as well as a comparison with similar homes in the area
Home Values in the Area
Average Home Value in this Area
Purchase History
| Date | Buyer | Sale Price | Title Company |
|---|---|---|---|
| Clinard Timothy L | $99,000 | None Available | |
| Boone Harvey S | $149,500 | None Available | |
| Campbell Karen | -- | -- | |
| Clinard Timothy | $79,900 | -- |
Source: Public Records
Mortgage History
| Date | Status | Borrower | Loan Amount |
|---|---|---|---|
| Open | Clinard Timothy L | $97,171 | |
| Previous Owner | Boone Harvey S | $146,697 |
Source: Public Records
Tax History
| Year | Tax Paid | Tax Assessment Tax Assessment Total Assessment is a certain percentage of the fair market value that is determined by local assessors to be the total taxable value of land and additions on the property. | Land | Improvement |
|---|---|---|---|---|
| 2025 | $1,545 | $197,440 | $62,020 | $135,420 |
| 2024 | $1,525 | $197,440 | $62,020 | $135,420 |
| 2023 | $1,525 | $197,440 | $62,020 | $135,420 |
| 2022 | $1,132 | $122,150 | $26,280 | $95,870 |
| 2021 | $1,132 | $122,150 | $26,280 | $95,870 |
| 2020 | $1,132 | $122,150 | $26,280 | $95,870 |
| 2019 | $1,132 | $122,150 | $26,280 | $95,870 |
| 2018 | $1,123 | $117,440 | $26,280 | $91,160 |
| 2016 | $1,099 | $117,436 | $26,280 | $91,156 |
| 2015 | $1,102 | $117,436 | $26,280 | $91,156 |
| 2014 | -- | $117,436 | $26,280 | $91,156 |
Source: Public Records
Map
Nearby Homes
- 3856 Azalea Ln
- 5406 Finch Farm Rd
- 3954 Evergreen Dr
- 4177 Dawnwood Dr
- 6919 Quarter Horse Dr
- 6953 Quarter Horse Dr
- 4243 Dawnwood Dr
- 6947 Saddlebred Dr
- 6265 Lowerywood Cir
- Lot 12 Bellawood Dr
- 4511 Jordan St
- 4997 Payne St
- 4850 Hopewell Church Rd
- 3523 Old Mountain Rd
- 4567 Red Oak Dr
- 6821 Stone Gables Dr
- 4588 Red Oak Dr
- 6901 Stone Gables Dr
- 7307 Lansdowne Place
- 4561 Red Oak Dr
- 3842 Fox Meadow Rd
- 3835 Fox Meadow Rd
- 3823 Fox Meadow Rd
- 3841 Fox Meadow Rd
- 3870 Fox Meadow Rd
- 3809 Fox Meadow Rd
- 3857 Fox Meadow Rd
- 0 Fox Meadow Ln Unit 38680474
- 3838 Greenway Dr
- 3863 Fox Meadow Rd
- 3818 Greenway Dr
- 6609 Erik Dr
- 6619 Erik Dr
- 3854 Greenway Dr
- 3876 Fox Meadow Rd
- 3810 Greenway Dr
- 6711 Erik Dr
- 4017 Lakewood Cir
- 6719 Erik Dr
- 3866 Greenway Dr
Your Personal Tour Guide
Ask me questions while you tour the home.