3828 Inverness Way Augusta, GA 30907
Estimated Value: $702,946 - $887,000
5
Beds
5
Baths
4,269
Sq Ft
$188/Sq Ft
Est. Value
About This Home
This home is located at 3828 Inverness Way, Augusta, GA 30907 and is currently estimated at $800,737, approximately $187 per square foot. 3828 Inverness Way is a home located in Columbia County with nearby schools including Stevens Creek Elementary School, Stallings Island Middle School, and Lakeside High School.
Ownership History
Date
Name
Owned For
Owner Type
Purchase Details
Closed on
Jan 29, 2020
Sold by
Stevens Mark
Bought by
Stevens Mark R and Stevens Mark R
Current Estimated Value
Purchase Details
Closed on
Oct 18, 2006
Sold by
Kirsch Gordon J
Bought by
Stevens Mark
Home Financials for this Owner
Home Financials are based on the most recent Mortgage that was taken out on this home.
Original Mortgage
$372,000
Interest Rate
6.31%
Mortgage Type
New Conventional
Purchase Details
Closed on
Mar 29, 2004
Sold by
Fry Darrel K and Fry Joni R
Bought by
Kirsch Gordon J and Kirsch Catherine A
Home Financials for this Owner
Home Financials are based on the most recent Mortgage that was taken out on this home.
Original Mortgage
$200,000
Interest Rate
5.53%
Mortgage Type
Purchase Money Mortgage
Create a Home Valuation Report for This Property
The Home Valuation Report is an in-depth analysis detailing your home's value as well as a comparison with similar homes in the area
Home Values in the Area
Average Home Value in this Area
Purchase History
| Date | Buyer | Sale Price | Title Company |
|---|---|---|---|
| Stevens Mark R | -- | -- | |
| Stevens Mark | $465,000 | -- | |
| Kirsch Gordon J | $388,000 | -- |
Source: Public Records
Mortgage History
| Date | Status | Borrower | Loan Amount |
|---|---|---|---|
| Previous Owner | Stevens Mark | $372,000 | |
| Previous Owner | Kirsch Gordon J | $200,000 |
Source: Public Records
Tax History Compared to Growth
Tax History
| Year | Tax Paid | Tax Assessment Tax Assessment Total Assessment is a certain percentage of the fair market value that is determined by local assessors to be the total taxable value of land and additions on the property. | Land | Improvement |
|---|---|---|---|---|
| 2025 | $6,743 | $280,374 | $45,904 | $234,470 |
| 2024 | $2,157 | $268,239 | $45,904 | $222,335 |
| 2023 | $2,157 | $254,258 | $42,904 | $211,354 |
| 2022 | $1,950 | $221,103 | $43,304 | $177,799 |
| 2021 | $1,767 | $190,012 | $30,804 | $159,208 |
| 2020 | $5,168 | $186,038 | $28,504 | $157,534 |
| 2019 | $5,082 | $182,912 | $29,604 | $153,308 |
| 2018 | $4,988 | $178,917 | $27,804 | $151,113 |
| 2017 | $4,882 | $174,515 | $28,804 | $145,711 |
| 2016 | $4,559 | $169,022 | $27,280 | $141,742 |
| 2015 | $4,494 | $166,287 | $25,980 | $140,307 |
| 2014 | $4,428 | $161,815 | $28,980 | $132,835 |
Source: Public Records
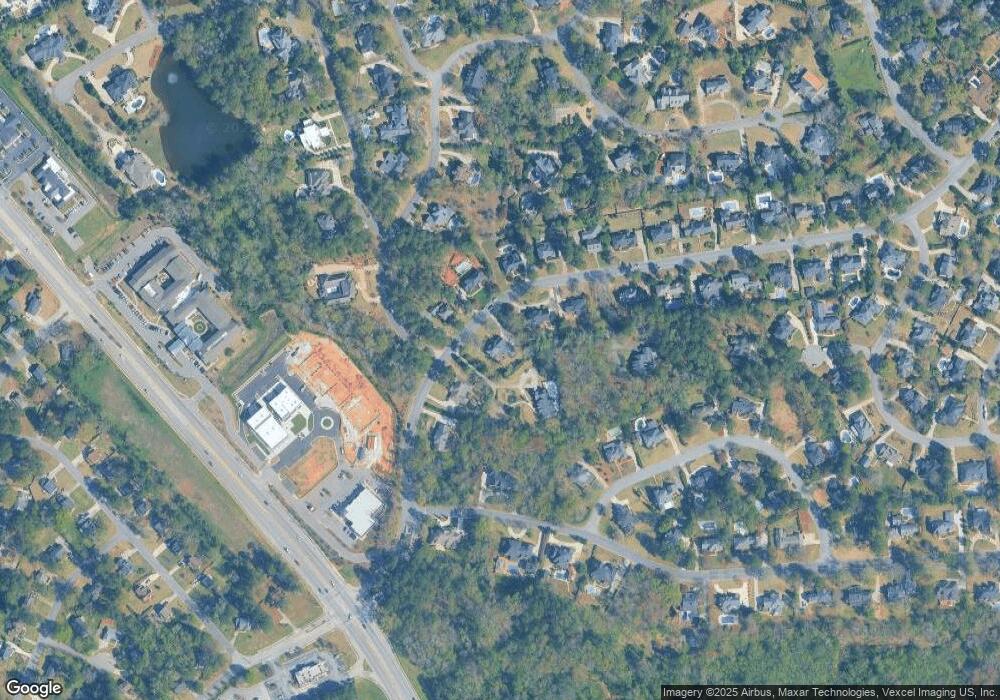
Map
Nearby Homes
- 3810 Inverness Way
- 615 Baytree Ct
- 3812 Forest Creek Way
- 619 Baytree Ct
- 3829 Villa Ln
- 535 Crystal Creek E
- 615 Saw Grass Dr
- 3666 Bay Point
- 519 Seminole Place
- 4020 Firethorn Ct
- 499 Crystal Creek W
- 694 Woodhall Abbey Ct
- 511 Crystal Creek W
- 513 Crystal Creek W
- 798 Osprey Ln
- 4120 Shady Oaks Dr
- 3710 Inverness Way
- 500 Oak Chase Dr
- 0 Osprey Ln Unit 546209
- 499 Oak Chase Dr
- 3824 Inverness Way
- 3832 Inverness Way
- 3830 Inverness Way
- 3827 Inverness Way
- 3825 Inverness Way
- 3820 Inverness Way
- 3823 Inverness Way
- 3836 Inverness Way
- 3821 Inverness Way
- 3822 Inverness Way
- 601 High Hampton Dr
- 3706 W Lake Dr
- 3819 Inverness Way
- 3818 Inverness Way
- 615 W Lake Cir
- 617 W Lake Cir
- 596 High Hampton Dr
- 3817 Inverness Way
- 613 Brae Burn Ct
- 603 High Hampton Dr