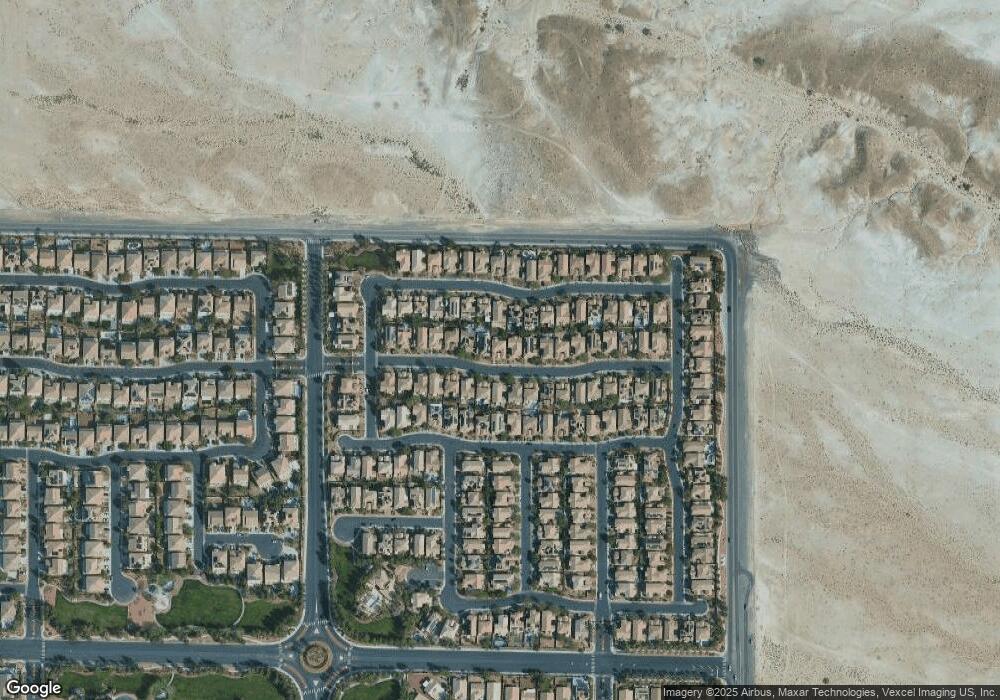
3828 Lower Saxon Ave North Las Vegas, NV 89085
Aliante NeighborhoodEstimated Value: $521,165 - $542,000
3
Beds
4
Baths
2,505
Sq Ft
$212/Sq Ft
Est. Value
About This Home
This home is located at 3828 Lower Saxon Ave, North Las Vegas, NV 89085 and is currently estimated at $532,041, approximately $212 per square foot. 3828 Lower Saxon Ave is a home located in Clark County with nearby schools including Vincent L. Triggs Elementary School, Anthony Saville Middle School, and Shadow Ridge High School.
Ownership History
Date
Name
Owned For
Owner Type
Purchase Details
Closed on
Aug 18, 2006
Sold by
Centex Homes
Bought by
Stewart Scott P and Stewart Evelyn R
Current Estimated Value
Home Financials for this Owner
Home Financials are based on the most recent Mortgage that was taken out on this home.
Original Mortgage
$383,400
Outstanding Balance
$230,187
Interest Rate
6.76%
Mortgage Type
VA
Estimated Equity
$301,854
Create a Home Valuation Report for This Property
The Home Valuation Report is an in-depth analysis detailing your home's value as well as a comparison with similar homes in the area
Home Values in the Area
Average Home Value in this Area
Purchase History
| Date | Buyer | Sale Price | Title Company |
|---|---|---|---|
| Stewart Scott P | $426,000 | Commerce Title |
Source: Public Records
Mortgage History
| Date | Status | Borrower | Loan Amount |
|---|---|---|---|
| Open | Stewart Scott P | $383,400 |
Source: Public Records
Tax History Compared to Growth
Tax History
| Year | Tax Paid | Tax Assessment Tax Assessment Total Assessment is a certain percentage of the fair market value that is determined by local assessors to be the total taxable value of land and additions on the property. | Land | Improvement |
|---|---|---|---|---|
| 2025 | $2,244 | $167,074 | $39,900 | $127,174 |
| 2024 | $2,198 | $167,074 | $39,900 | $127,174 |
| 2023 | $2,198 | $163,661 | $38,850 | $124,811 |
| 2022 | $1,873 | $135,463 | $33,250 | $102,213 |
| 2021 | $1,617 | $122,638 | $30,800 | $91,838 |
| 2020 | $1,723 | $118,678 | $30,100 | $88,578 |
| 2019 | $2,081 | $113,212 | $26,950 | $86,262 |
| 2018 | $1,543 | $97,334 | $21,700 | $75,634 |
| 2017 | $2,323 | $92,222 | $19,250 | $72,972 |
| 2016 | $2,160 | $88,215 | $14,350 | $73,865 |
| 2015 | $2,156 | $74,151 | $14,350 | $59,801 |
| 2014 | $2,093 | $60,121 | $10,500 | $49,621 |
Source: Public Records
Map
Nearby Homes
- 8224 Chimney Bluffs St
- 4108 Lower Saxon Ave
- 3809 Bracebridge Falls Ave
- 8048 Slate Falls St
- 8217 Sawmill Falls St
- 8128 Devils Canyon St
- 3765 Helens Pouroff Ave
- 8021 Glacier Falls St
- 4329 Desert Haven Ave
- 4333 Desert Haven Ave
- 7933 Rachelis St
- 4424 Desert Home Ave
- 4421 Desert Park Ave
- 4016 Floating Fern Ave
- 4024 Floating Fern Ave
- 4330 Oasis Hill Ave
- 3516 Herring Gull Ln Unit 3
- 4315 Oasis Plains Ave
- 7908 Stone Forest St
- 7905 Lily Trotter St
- 3824 Lower Saxon Ave
- 3832 Lower Saxon Ave
- 3836 Lower Saxon Ave
- 3836 Lower Saxon Ave Unit none
- 3820 Lower Saxon Ave
- 3829 Moonshine Falls Ave
- 3825 Moonshine Falls Ave
- 3833 Moonshine Falls Ave
- 3821 Moonshine Falls Ave
- 3829 Lower Saxon Ave
- 3833 Lower Saxon Ave
- 3816 Lower Saxon Ave
- 3825 Lower Saxon Ave
- 3837 Moonshine Falls Ave
- 3837 Lower Saxon Ave
- 3821 Lower Saxon Ave
- 3817 Moonshine Falls Ave
- 3905 Lower Saxon Ave
- 3905 Moonshine Falls Ave Unit 4B
