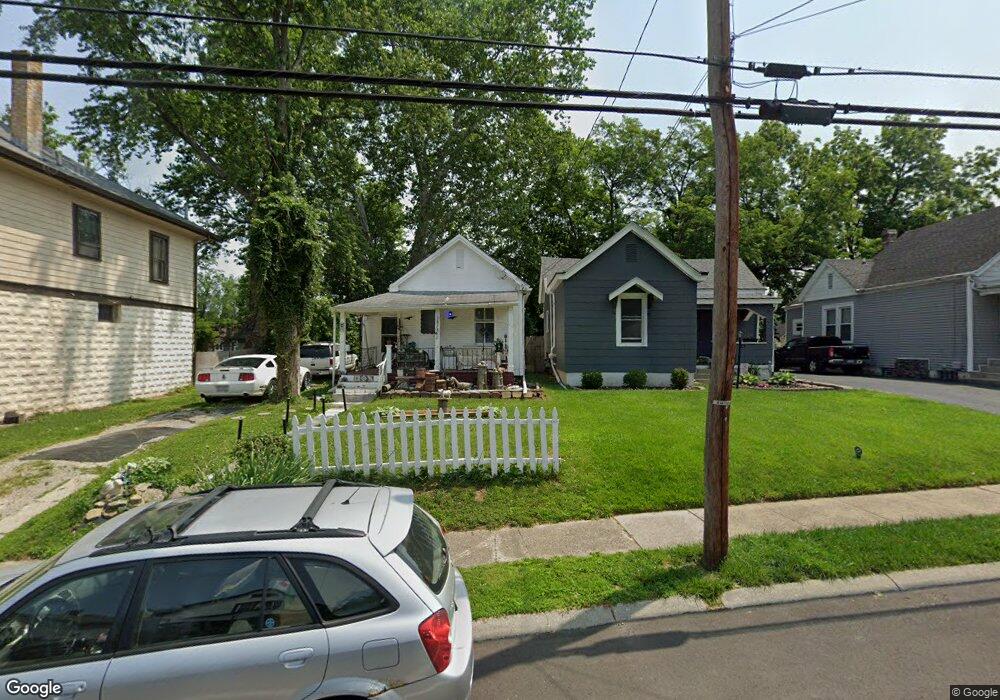
3828 Watterson Rd Cincinnati, OH 45227
Estimated Value: $155,000 - $509,000
1
Bed
1
Bath
686
Sq Ft
$382/Sq Ft
Est. Value
About This Home
This home is located at 3828 Watterson Rd, Cincinnati, OH 45227 and is currently estimated at $261,888, approximately $381 per square foot. 3828 Watterson Rd is a home located in Hamilton County with nearby schools including Terrace Park Elementary School, Mariemont Elementary School, and Mariemont Junior High School.
Ownership History
Date
Name
Owned For
Owner Type
Purchase Details
Closed on
Apr 14, 2016
Sold by
Ryan Sean Keeley
Bought by
Overstreet Kenneth
Current Estimated Value
Home Financials for this Owner
Home Financials are based on the most recent Mortgage that was taken out on this home.
Original Mortgage
$31,482
Outstanding Balance
$24,653
Interest Rate
3.58%
Estimated Equity
$237,235
Purchase Details
Closed on
Apr 12, 2016
Sold by
Keeley Ryan Sean
Bought by
Overstreet Kenneth
Home Financials for this Owner
Home Financials are based on the most recent Mortgage that was taken out on this home.
Original Mortgage
$31,482
Outstanding Balance
$24,653
Interest Rate
3.58%
Estimated Equity
$237,235
Purchase Details
Closed on
Aug 15, 2000
Sold by
Taylor Kenneth F Trs & Francis L Trs
Bought by
Keeley Ryan Sean and Keeley Marie D
Home Financials for this Owner
Home Financials are based on the most recent Mortgage that was taken out on this home.
Original Mortgage
$35,200
Interest Rate
8.75%
Purchase Details
Closed on
Mar 14, 1996
Sold by
Leedham Melinda Pitser and Leedham David G
Bought by
Taylor Kenneth F and Taylor Francis L
Purchase Details
Closed on
Mar 13, 1996
Sold by
Whitney Shirley Ann Raquel and Steffee Shirley Ann Pitser
Bought by
Taylor Kenneth F and Taylor Francis L
Create a Home Valuation Report for This Property
The Home Valuation Report is an in-depth analysis detailing your home's value as well as a comparison with similar homes in the area
Home Values in the Area
Average Home Value in this Area
Purchase History
| Date | Buyer | Sale Price | Title Company |
|---|---|---|---|
| Overstreet Kenneth | -- | -- | |
| Overstreet Kenneth | $34,980 | -- | |
| Keeley Ryan Sean | $44,000 | Blue Chip Title Agency Inc | |
| Taylor Kenneth F | $10,000 | -- | |
| Taylor Kenneth F | $10,000 | -- |
Source: Public Records
Mortgage History
| Date | Status | Borrower | Loan Amount |
|---|---|---|---|
| Open | Overstreet Kenneth | $31,482 | |
| Closed | Overstreet Kenneth | -- | |
| Closed | Overstreet Kenneth | -- | |
| Previous Owner | Keeley Ryan Sean | $35,200 |
Source: Public Records
Tax History
| Year | Tax Paid | Tax Assessment Tax Assessment Total Assessment is a certain percentage of the fair market value that is determined by local assessors to be the total taxable value of land and additions on the property. | Land | Improvement |
|---|---|---|---|---|
| 2025 | $3,235 | $43,187 | $20,136 | $23,051 |
| 2024 | $3,165 | $43,187 | $20,136 | $23,051 |
| 2023 | $2,937 | $43,187 | $20,136 | $23,051 |
| 2022 | $1,923 | $23,422 | $7,028 | $16,394 |
| 2021 | $1,838 | $23,422 | $7,028 | $16,394 |
| 2020 | $1,859 | $23,422 | $7,028 | $16,394 |
| 2019 | $1,818 | $20,728 | $6,220 | $14,508 |
| 2018 | $1,776 | $20,728 | $6,220 | $14,508 |
| 2017 | $1,524 | $20,728 | $6,220 | $14,508 |
| 2016 | $1,444 | $18,865 | $6,216 | $12,649 |
| 2015 | $1,442 | $18,865 | $6,216 | $12,649 |
| 2014 | $1,447 | $18,865 | $6,216 | $12,649 |
| 2013 | $1,336 | $18,316 | $6,034 | $12,282 |
Source: Public Records
Map
Nearby Homes
- 6208 Bancroft St
- 3904 Germania St
- 3910 Germania St
- 3730 Simpson Ave
- 3723 Carlton Ave
- 3710 Watterson Rd
- 3645 Birkdale Ln
- 3669 Birkdale Ln
- 6307 Wooster Pike
- 3665 Birkdale Ln
- 3657 Birkdale Ln
- 3653 Birkdale Ln
- 3662 Birkdale Ln
- 3649 Birkdale Ln
- 3641 Birkdale Ln
- 4115 Homer Ave
- 3795 Meadowlark Ln
- 6017 Bramble Ave
- 6007 Wooster Pike
- 5581 Nightingale Ct
- 3830 Watterson Rd
- 3826 Watterson Rd
- 3824 Watterson Rd
- 3891 Watterson Rd
- 3822 Watterson Rd
- 3827 Simpson Ave
- 3829 Simpson Ave
- 3902 Watterson Rd
- 3823 Simpson Ave
- 3820 Watterson Rd
- 3825 Simpson Ave
- 3904 Watterson Rd
- 3825 Watterson Rd
- 3827 Watterson Rd
- 3823 Watterson Rd
- 6108 Elder St
- 3829 Watterson Rd
- 3821 Simpson Ave
- 3821 Watterson Rd
- 6110 Elder St
Your Personal Tour Guide
Ask me questions while you tour the home.