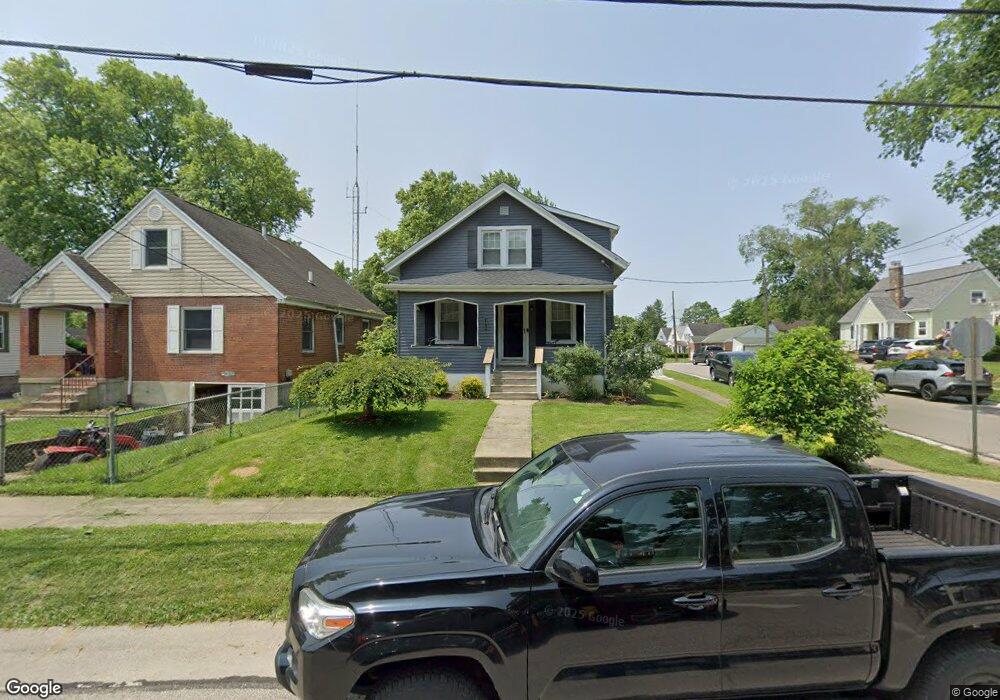
3829 Carlton St Cincinnati, OH 45227
Estimated Value: $299,000 - $431,000
3
Beds
2
Baths
1,591
Sq Ft
$220/Sq Ft
Est. Value
About This Home
This home is located at 3829 Carlton St, Cincinnati, OH 45227 and is currently estimated at $349,555, approximately $219 per square foot. 3829 Carlton St is a home located in Hamilton County with nearby schools including Terrace Park Elementary School, Mariemont Elementary School, and Mariemont Junior High School.
Ownership History
Date
Name
Owned For
Owner Type
Purchase Details
Closed on
Mar 30, 2007
Sold by
Tighe Mike and Tighe Debbie
Bought by
Owens Victoria M
Current Estimated Value
Home Financials for this Owner
Home Financials are based on the most recent Mortgage that was taken out on this home.
Original Mortgage
$138,902
Outstanding Balance
$84,445
Interest Rate
6.25%
Mortgage Type
FHA
Estimated Equity
$265,110
Purchase Details
Closed on
Sep 12, 2000
Sold by
George Tepe Gary and George Jaynen L
Bought by
Tighe Mike and Tighe Debbie
Home Financials for this Owner
Home Financials are based on the most recent Mortgage that was taken out on this home.
Original Mortgage
$60,000
Interest Rate
7.96%
Create a Home Valuation Report for This Property
The Home Valuation Report is an in-depth analysis detailing your home's value as well as a comparison with similar homes in the area
Home Values in the Area
Average Home Value in this Area
Purchase History
| Date | Buyer | Sale Price | Title Company |
|---|---|---|---|
| Owens Victoria M | $140,000 | The Main Title Agency | |
| Tighe Mike | $75,000 | -- |
Source: Public Records
Mortgage History
| Date | Status | Borrower | Loan Amount |
|---|---|---|---|
| Open | Owens Victoria M | $138,902 | |
| Previous Owner | Tighe Mike | $60,000 |
Source: Public Records
Tax History Compared to Growth
Tax History
| Year | Tax Paid | Tax Assessment Tax Assessment Total Assessment is a certain percentage of the fair market value that is determined by local assessors to be the total taxable value of land and additions on the property. | Land | Improvement |
|---|---|---|---|---|
| 2024 | $6,024 | $82,097 | $20,136 | $61,961 |
| 2023 | $5,587 | $82,097 | $20,136 | $61,961 |
| 2022 | $5,309 | $64,667 | $10,812 | $53,855 |
| 2021 | $4,920 | $50,877 | $10,812 | $40,065 |
| 2020 | $4,036 | $50,877 | $10,812 | $40,065 |
| 2019 | $3,946 | $45,024 | $9,569 | $35,455 |
| 2018 | $3,855 | $45,024 | $9,569 | $35,455 |
| 2017 | $3,309 | $45,024 | $9,569 | $35,455 |
| 2016 | $2,966 | $38,777 | $9,562 | $29,215 |
| 2015 | $2,961 | $38,777 | $9,562 | $29,215 |
| 2014 | $2,971 | $38,777 | $9,562 | $29,215 |
| 2013 | $2,746 | $37,646 | $9,282 | $28,364 |
Source: Public Records
Map
Nearby Homes
- 3812 Carlton St
- 6208 Bancroft St
- 6219 Bedford St
- 3690 Birkdale Ln
- St Martin Plan at Birkdale
- 3645 Birkdale Ln
- 5809 Elder St
- 3674 Birkdale Ln
- 3670 Birkdale Ln
- 3662 Birkdale Ln
- 3806 Southern Ave
- 3726 Southern Ave
- 6576 Wooster Pike
- 3986 S Whetzel Ave
- 4115 Homer Ave
- 3805 Meadowlark Ln
- 3795 Meadowlark Ln
- 6417 Bramble Ave
- 6001 Bramble Ave
- 5919 Bramble Ave
- 3827 Carlton St
- 3825 Carlton St
- 3823 Carlton St
- 3823 Carlton Ave
- 3828 Simpson Ave
- 3832 Simpson Ave
- 6210 Elder St
- 6212 Elder St
- 3826 Simpson Ave
- 6208 Elder St
- 6214 Elder St
- 3821 Carlton St
- 6206 Elder St
- 3830 Carlton St
- 3828 Carlton St
- 3904 Simpson Ave
- 3826 Carlton Ave
- 3902 Carlton St
- 3902 Carlton Ave
- 3819 Carlton St