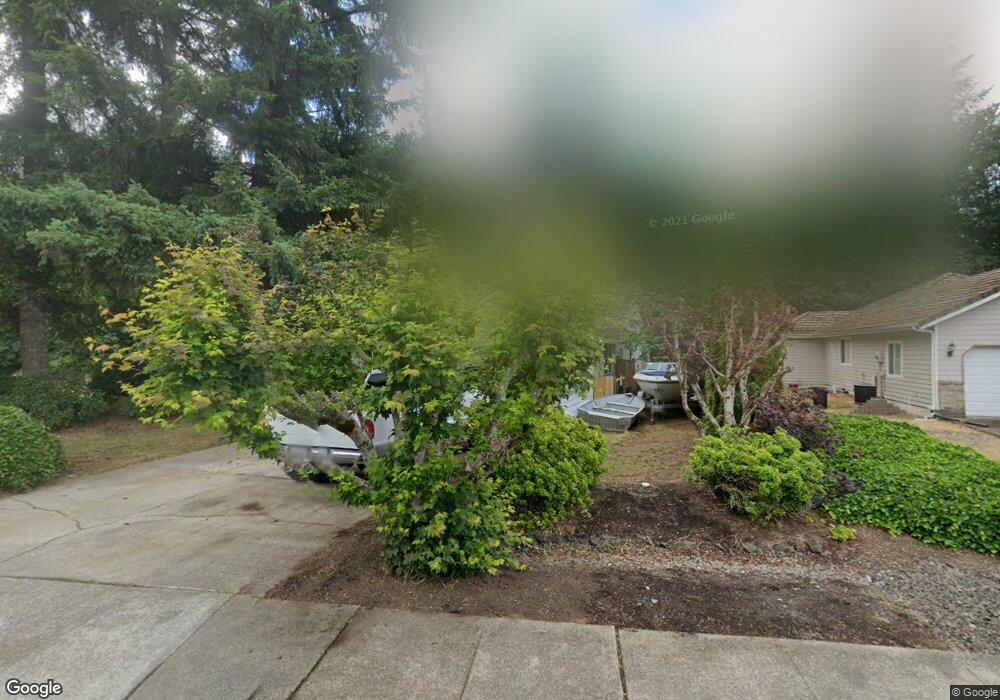
3829 Cortez Loop SW Olympia, WA 98512
Littlerock NeighborhoodEstimated Value: $563,295 - $577,000
3
Beds
2
Baths
1,728
Sq Ft
$330/Sq Ft
Est. Value
About This Home
This home is located at 3829 Cortez Loop SW, Olympia, WA 98512 and is currently estimated at $571,074, approximately $330 per square foot. 3829 Cortez Loop SW is a home located in Thurston County with nearby schools including Black Lake Elementary School, Tumwater Middle School, and A.G. West Black Hills High School.
Ownership History
Date
Name
Owned For
Owner Type
Purchase Details
Closed on
Feb 19, 2014
Sold by
Mills Dorsey Jennifer L
Bought by
Dorsey Darin L
Current Estimated Value
Purchase Details
Closed on
Apr 8, 2004
Sold by
Klotz Aaron D and Klotz Dionna M
Bought by
Dorsey Darin L and Dorsey Jennifer L
Home Financials for this Owner
Home Financials are based on the most recent Mortgage that was taken out on this home.
Original Mortgage
$175,900
Interest Rate
4.62%
Mortgage Type
Purchase Money Mortgage
Purchase Details
Closed on
Jun 9, 1998
Sold by
Walker Elijah Christine L
Bought by
Klotz Aaron D and Klotz Dionna M
Home Financials for this Owner
Home Financials are based on the most recent Mortgage that was taken out on this home.
Original Mortgage
$161,500
Interest Rate
7.17%
Create a Home Valuation Report for This Property
The Home Valuation Report is an in-depth analysis detailing your home's value as well as a comparison with similar homes in the area
Home Values in the Area
Average Home Value in this Area
Purchase History
| Date | Buyer | Sale Price | Title Company |
|---|---|---|---|
| Dorsey Darin L | -- | None Available | |
| Dorsey Darin L | $219,900 | Chicago Title Co | |
| Klotz Aaron D | $170,000 | First American Title Ins Co |
Source: Public Records
Mortgage History
| Date | Status | Borrower | Loan Amount |
|---|---|---|---|
| Previous Owner | Dorsey Darin L | $175,900 | |
| Previous Owner | Klotz Aaron D | $161,500 |
Source: Public Records
Tax History Compared to Growth
Tax History
| Year | Tax Paid | Tax Assessment Tax Assessment Total Assessment is a certain percentage of the fair market value that is determined by local assessors to be the total taxable value of land and additions on the property. | Land | Improvement |
|---|---|---|---|---|
| 2024 | $5,022 | $520,900 | $199,400 | $321,500 |
| 2023 | $5,022 | $501,700 | $174,500 | $327,200 |
| 2022 | $4,596 | $459,900 | $138,800 | $321,100 |
| 2021 | $4,147 | $383,700 | $118,000 | $265,700 |
| 2020 | $4,052 | $316,200 | $114,600 | $201,600 |
| 2019 | $3,692 | $299,900 | $79,900 | $220,000 |
| 2018 | $3,638 | $275,500 | $85,100 | $190,400 |
| 2017 | $3,720 | $276,700 | $82,600 | $194,100 |
| 2016 | $3,589 | $263,450 | $88,650 | $174,800 |
| 2014 | -- | $256,950 | $88,650 | $168,300 |
Source: Public Records
Map
Nearby Homes
- 7025 Cavalier St SW
- 7026 Cavalier St SW
- 3244 66th Ave SW Unit 33
- 6137 Kirsop Rd SW
- 3140 66th Ave SW
- 3021 70th Way SW
- 7049 Rothenberg Dr SW
- 4045 49th Ave SW Unit 55
- 4045 49th Ave SW Unit 70
- 4045 49th Ave SW Unit 7
- 4045 49th Ave SW Unit 74
- 4027 Dent Rd SW
- 7008 Southwick Ct SW
- 7022 Lazy Ct SW
- 7302 Jenner St SW Unit Lot 64
- 7303 Mirasett St SW Unit Lot 30
- 7309 Mirasett St SW Unit Lot 31
- 6109 Guerin St SW
- 5647 Black Lake Blvd SW
- 7431 Jenner St SW Unit Lot 60
- 0 Fish Pond Creek Dr SW
- 3837 Cortez Loop SW
- 3845 Cortez Loop SW
- 3836 Cortez Loop SW
- 3919 Cortez Loop SW
- 3828 Cortez Loop SW
- 3918 Cortez Loop SW
- 3822 Cortez Loop SW
- 3925 Cortez Loop SW
- 6410 Jody Ct SW
- 3819 Cortez Loop SW
- 6420 Jody Ct SW
- 6336 Jody Ct SW
- 6324 Jody Ct SW
- 3820 Cortez Loop SW
- 3817 Cortez Loop SW
- 3647 65th Ave SW
- 6316 Jody Ct SW
- 6421 Jody Ct SW
- 3815 Cortez Loop SW