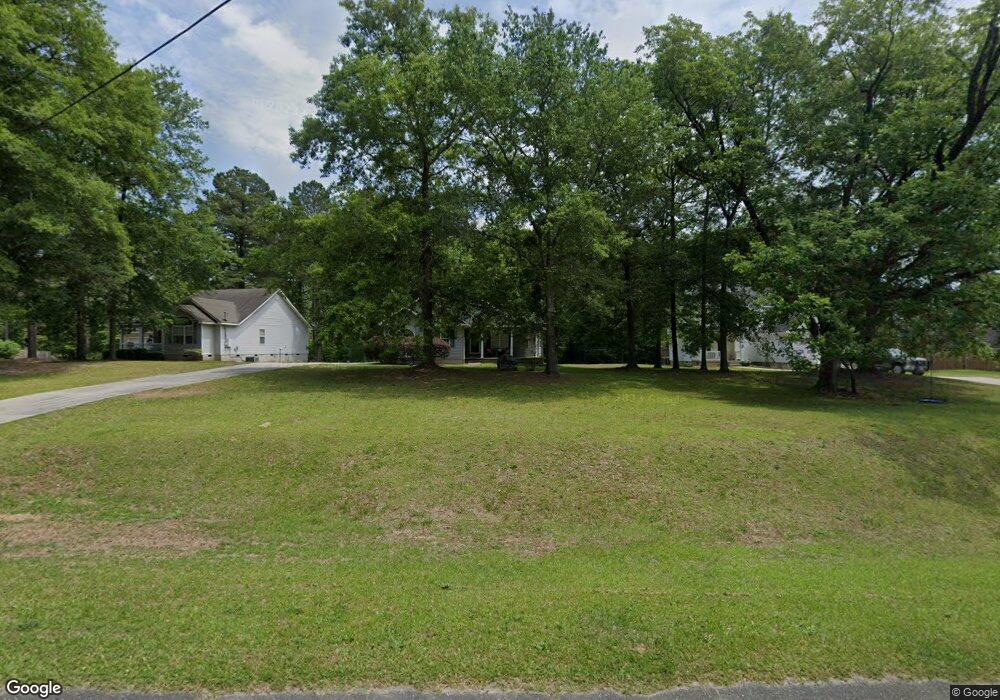
383 Chapman Rd Macon, GA 31211
Estimated Value: $197,036 - $225,000
Studio
2
Baths
1,366
Sq Ft
$156/Sq Ft
Est. Value
About This Home
This home is located at 383 Chapman Rd, Macon, GA 31211 and is currently estimated at $212,759, approximately $155 per square foot. 383 Chapman Rd is a home located in Jones County with nearby schools including Mattie Wells Elementary School, Clifton Ridge Middle School, and Jones County High School.
Ownership History
Date
Name
Owned For
Owner Type
Purchase Details
Closed on
Apr 25, 2006
Sold by
Not Provided
Bought by
Brown Latasha
Current Estimated Value
Home Financials for this Owner
Home Financials are based on the most recent Mortgage that was taken out on this home.
Original Mortgage
$103,200
Outstanding Balance
$62,598
Interest Rate
7.54%
Mortgage Type
New Conventional
Estimated Equity
$150,161
Purchase Details
Closed on
Aug 2, 2005
Sold by
Wells Fargo Bank
Bought by
Federal National Mtg Associati
Purchase Details
Closed on
Mar 25, 2004
Sold by
Davis Ashley D\B\A Davis Contr
Bought by
Burnsed Melinda K and Burnsed Kenneth J
Purchase Details
Closed on
Sep 8, 2003
Sold by
Locke Michael Anthony
Bought by
Davis Ashley D\B\A Davis Contractin
Purchase Details
Closed on
May 22, 2003
Sold by
Jones Harold Lamar
Bought by
Locke Michael Anthony
Purchase Details
Closed on
May 6, 2003
Sold by
Milholen Properties
Bought by
Jones Harold Lamar
Create a Home Valuation Report for This Property
The Home Valuation Report is an in-depth analysis detailing your home's value as well as a comparison with similar homes in the area
Purchase History
| Date | Buyer | Sale Price | Title Company |
|---|---|---|---|
| Brown Latasha | -- | -- | |
| Federal National Mtg Associati | $110,700 | -- | |
| Wells Fargo Bank | $110,700 | -- | |
| Burnsed Melinda K | $129,900 | -- | |
| Davis Ashley D\B\A Davis Contractin | $19,000 | -- | |
| Locke Michael Anthony | $174,000 | -- | |
| Jones Harold Lamar | $105,000 | -- |
Source: Public Records
Mortgage History
| Date | Status | Borrower | Loan Amount |
|---|---|---|---|
| Open | Brown Latasha | $103,200 | |
| Closed | Brown Latasha | $25,800 |
Source: Public Records
Tax History
| Year | Tax Paid | Tax Assessment Tax Assessment Total Assessment is a certain percentage of the fair market value that is determined by local assessors to be the total taxable value of land and additions on the property. | Land | Improvement |
|---|---|---|---|---|
| 2025 | $2,066 | $66,668 | $7,800 | $58,868 |
| 2024 | $1,632 | $49,647 | $6,000 | $43,647 |
| 2023 | $806 | $43,488 | $6,000 | $37,488 |
| 2022 | $1,429 | $43,488 | $6,000 | $37,488 |
| 2021 | $1,361 | $41,559 | $6,000 | $35,559 |
| 2020 | $1,362 | $41,559 | $6,000 | $35,559 |
| 2019 | $1,362 | $41,559 | $6,000 | $35,559 |
| 2018 | $1,362 | $41,559 | $6,000 | $35,559 |
| 2017 | $1,362 | $41,559 | $6,000 | $35,559 |
| 2016 | $1,362 | $41,559 | $6,000 | $35,559 |
| 2015 | $1,285 | $41,559 | $6,000 | $35,559 |
| 2014 | $1,189 | $41,559 | $6,000 | $35,559 |
Source: Public Records
Map
Nearby Homes
- 894 Chapman Dr
- 906 Chapman Dr
- 906 Chapman Dr Unit 46
- 912 Chapman Dr
- 912 Chapman Dr Unit 45
- 120 Chapman Ridge Lot #40 Rd
- 144 Graystone Cir
- 936 Chapman Dr
- 140 Chapman Ridge Rd
- 318 Graystone Pointe Dr
- 168 Chapman Ridge Rd
- 168 Chapman Ridge Rd Unit 28
- 123 Chapel Hill Cir
- 190 Chapman Ridge Lot 22 Rd
- 111 Haylie Ct
- 104 Haylie Ct
- 106 Haylie Ct
- 224 Rebel Dr
- 180 Rebel Dr
- 612 Kimberly Ct
Your Personal Tour Guide
Ask me questions while you tour the home.