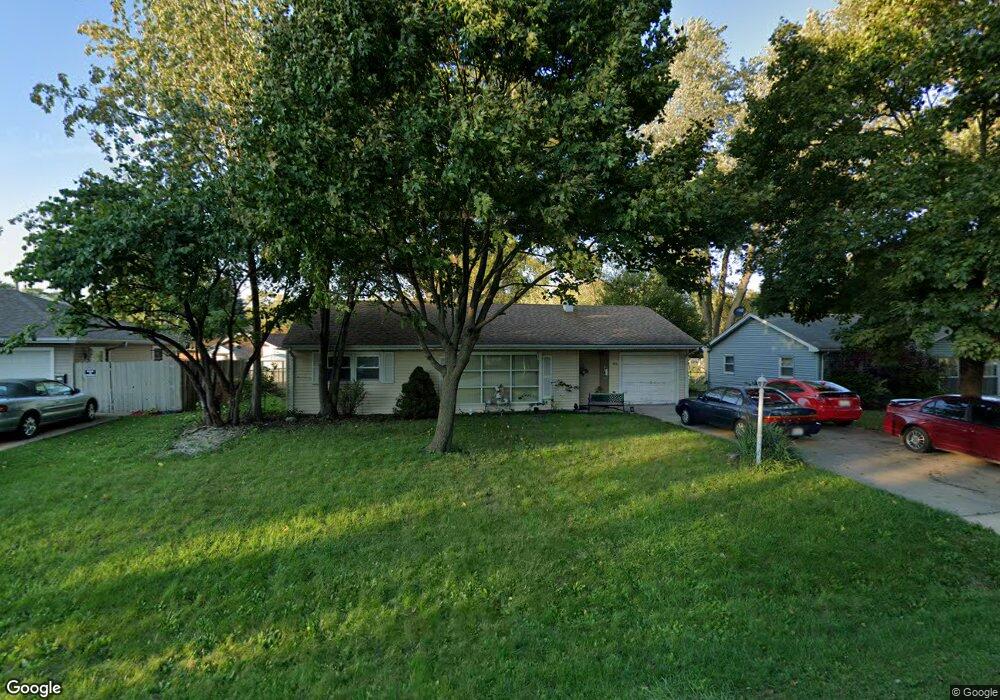
383 Colorado Ave Aurora, IL 60506
North River NeighborhoodEstimated Value: $229,994 - $246,000
2
Beds
1
Bath
994
Sq Ft
$240/Sq Ft
Est. Value
About This Home
This home is located at 383 Colorado Ave, Aurora, IL 60506 and is currently estimated at $238,249, approximately $239 per square foot. 383 Colorado Ave is a home located in Kane County with nearby schools including Hill Elementary School, Herget Middle School, and West Aurora High School.
Ownership History
Date
Name
Owned For
Owner Type
Purchase Details
Closed on
Jun 24, 2003
Sold by
Carter Tyson W
Bought by
Bullon Victoria R
Current Estimated Value
Home Financials for this Owner
Home Financials are based on the most recent Mortgage that was taken out on this home.
Original Mortgage
$127,500
Outstanding Balance
$54,187
Interest Rate
5.37%
Mortgage Type
Purchase Money Mortgage
Estimated Equity
$184,062
Purchase Details
Closed on
Sep 11, 2001
Sold by
Carter Tyson W and Carter Selena M
Bought by
Carter Tyson W
Home Financials for this Owner
Home Financials are based on the most recent Mortgage that was taken out on this home.
Original Mortgage
$97,600
Interest Rate
6.87%
Purchase Details
Closed on
Sep 23, 1998
Sold by
Graf Elizabeth
Bought by
Carter Tyson W and Carter Selena M
Home Financials for this Owner
Home Financials are based on the most recent Mortgage that was taken out on this home.
Original Mortgage
$76,860
Interest Rate
6.78%
Create a Home Valuation Report for This Property
The Home Valuation Report is an in-depth analysis detailing your home's value as well as a comparison with similar homes in the area
Home Values in the Area
Average Home Value in this Area
Purchase History
| Date | Buyer | Sale Price | Title Company |
|---|---|---|---|
| Bullon Victoria R | $127,500 | First American Title | |
| Carter Tyson W | -- | Dukane Title Insurance Co | |
| Carter Tyson W | $90,000 | -- |
Source: Public Records
Mortgage History
| Date | Status | Borrower | Loan Amount |
|---|---|---|---|
| Open | Bullon Victoria R | $127,500 | |
| Previous Owner | Carter Tyson W | $97,600 | |
| Previous Owner | Carter Tyson W | $76,860 |
Source: Public Records
Tax History
| Year | Tax Paid | Tax Assessment Tax Assessment Total Assessment is a certain percentage of the fair market value that is determined by local assessors to be the total taxable value of land and additions on the property. | Land | Improvement |
|---|---|---|---|---|
| 2024 | $1,412 | $60,984 | $13,260 | $47,724 |
| 2023 | $1,527 | $54,489 | $11,848 | $42,641 |
| 2022 | $2,021 | $49,716 | $10,810 | $38,906 |
| 2021 | $3,224 | $46,286 | $10,064 | $36,222 |
| 2020 | $2,137 | $42,993 | $9,348 | $33,645 |
| 2019 | $2,232 | $40,065 | $8,661 | $31,404 |
| 2018 | $2,279 | $36,461 | $8,011 | $28,450 |
| 2017 | $2,864 | $33,829 | $7,381 | $26,448 |
| 2016 | $2,485 | $29,395 | $6,327 | $23,068 |
| 2015 | -- | $25,484 | $5,441 | $20,043 |
| 2014 | -- | $27,138 | $5,233 | $21,905 |
| 2013 | -- | $28,479 | $5,158 | $23,321 |
Source: Public Records
Map
Nearby Homes
- 338 Lakelawn Blvd
- 355 Lawndale Ave
- 509 N Park Ave
- 14-18 N Lake St
- 418 W Illinois Ave
- 1060 N Highland Ave
- 1062 N Highland Ave
- 603 N May St
- 519 N View St
- 415 Blackhawk St
- 837 Taylor Ave
- 231-233 Williams St
- 507 W Park Ave
- 847 Foran Ln
- 773 Aurora Ave
- 479 N Lake St
- 920 Zenner Ave
- 469 N Lake St
- 304 Hankes Ave
- 461 Sullivan Rd
- 377 Colorado Ave
- 387 Colorado Ave
- 382 Michigan Ave
- 378 Michigan Ave
- 386 Michigan Ave
- 944 Pennsylvania Ave
- 391 Colorado Ave
- 946 Pennsylvania Ave
- 382 Colorado Ave
- 390 Michigan Ave
- 386 Colorado Ave
- 378 Colorado Ave
- 393 Colorado Ave
- 934 Pennsylvania Ave
- 390 Colorado Ave
- 392 Michigan Ave
- 392 Colorado Ave
- 943 Pennsylvania Ave
- 397 Colorado Ave
- 383 Michigan Ave
Your Personal Tour Guide
Ask me questions while you tour the home.