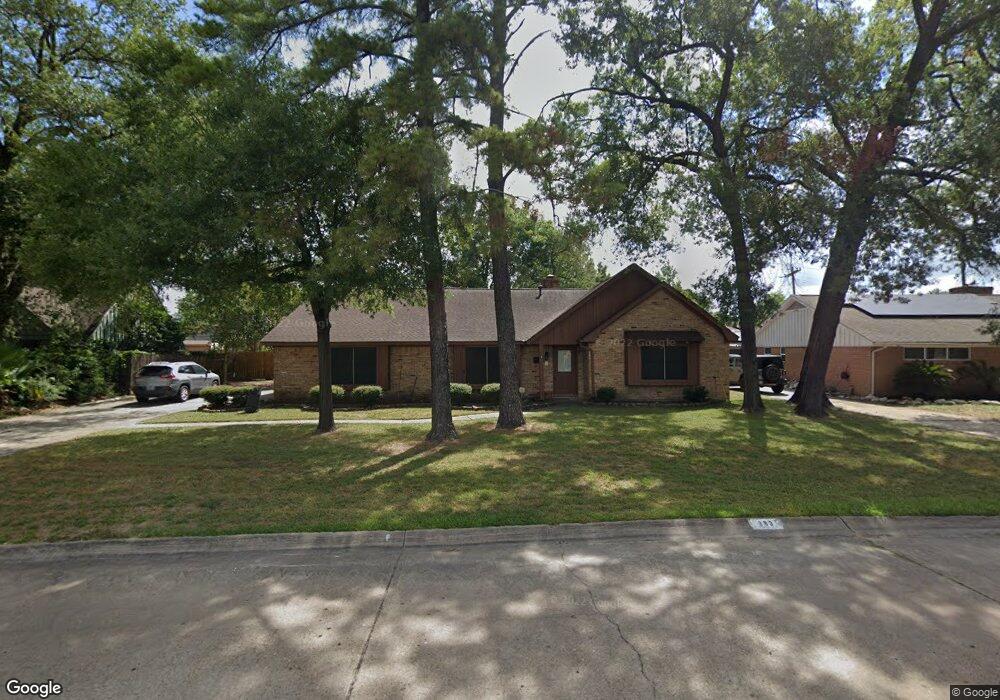
383 Connaught Way Houston, TX 77015
Estimated Value: $247,241 - $288,000
3
Beds
2
Baths
2,021
Sq Ft
$133/Sq Ft
Est. Value
About This Home
This home is located at 383 Connaught Way, Houston, TX 77015 and is currently estimated at $269,560, approximately $133 per square foot. 383 Connaught Way is a home located in Harris County with nearby schools including James B. Havard Elementary School, Cobb 6th Grade Campus, and North Shore Middle School.
Create a Home Valuation Report for This Property
The Home Valuation Report is an in-depth analysis detailing your home's value as well as a comparison with similar homes in the area
Home Values in the Area
Average Home Value in this Area
Tax History Compared to Growth
Tax History
| Year | Tax Paid | Tax Assessment Tax Assessment Total Assessment is a certain percentage of the fair market value that is determined by local assessors to be the total taxable value of land and additions on the property. | Land | Improvement |
|---|---|---|---|---|
| 2025 | $501 | $238,236 | $70,696 | $167,540 |
| 2024 | $501 | $239,804 | $53,022 | $186,782 |
| 2023 | $239 | $277,309 | $53,022 | $224,287 |
| 2022 | $4,156 | $239,492 | $53,022 | $186,470 |
| 2021 | $4,110 | $192,151 | $41,534 | $150,617 |
| 2020 | $3,811 | $164,859 | $41,534 | $123,325 |
| 2019 | $3,620 | $134,280 | $36,677 | $97,603 |
| 2018 | $373 | $134,280 | $36,677 | $97,603 |
| 2017 | $3,522 | $134,280 | $36,677 | $97,603 |
| 2016 | $3,202 | $124,815 | $28,818 | $95,997 |
| 2015 | $762 | $123,326 | $28,818 | $94,508 |
| 2014 | $762 | $98,168 | $28,818 | $69,350 |
Source: Public Records
Map
Nearby Homes
- 13915 Roundstone Ln
- 346 Ballantrae Ln
- 505 Evanston St
- 13529 Granada St
- 13907 Duncannon Dr
- 13911 Waterville Way
- TBD Gainesville St
- 14018 Duncannon Dr
- 415 Sevenhampton Ln
- 242 Saint Finans Way
- 530 Frankie St Unit 1
- 13415 Castilian Dr Unit 1
- 271 Shekel Ln
- 13351 Oak Leaf Ln
- 330 Breeze Park Dr
- 14131 Woodforest Blvd
- 326 Breeze Park Dr
- 13527 Castilian Dr Unit 1
- 13350 Granada St
- 14143 Roundstone Ln
- 379 Connaught Way
- 387 Connaught Way
- 390 Kingscourt Dr
- 386 Kingscourt Dr
- 394 Kingscourt Dr
- 382 Kingscourt Dr
- 386 Connaught Way
- 375 Connaught Way
- 382 Connaught Way
- 13803 Woodforest Blvd
- 390 Connaught Way
- 13807 Woodforest Blvd
- 378 Connaught Way
- 378 Kingscourt Dr
- 395 Kingscourt Dr
- 394 Connaught Way
- 13811 Woodforest Blvd
- 387 Kingscourt Dr
- 374 Connaught Way
- 383 Kingscourt Dr