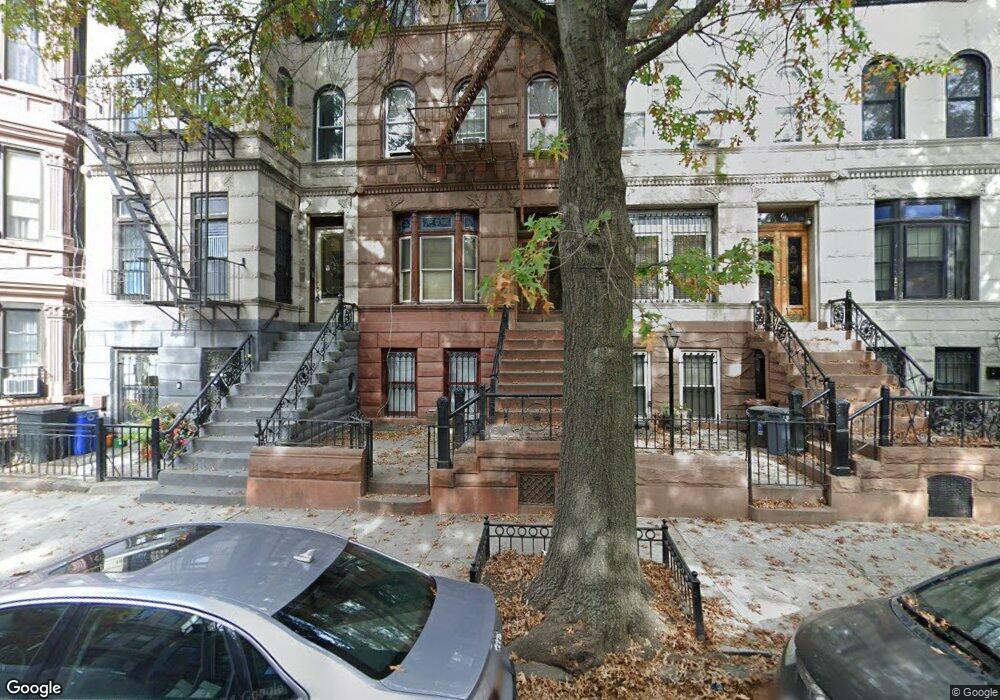
383 Hancock St Brooklyn, NY 11216
Bed-Stuy NeighborhoodEstimated Value: $1,755,000 - $2,373,000
5
Beds
3
Baths
3,272
Sq Ft
$654/Sq Ft
Est. Value
About This Home
This home is located at 383 Hancock St, Brooklyn, NY 11216 and is currently estimated at $2,141,333, approximately $654 per square foot. 383 Hancock St is a home located in Kings County with nearby schools including P.S. 44 Marcus Garvey, Unity Preparatory Charter School of Brooklyn, and The Co-Op School.
Ownership History
Date
Name
Owned For
Owner Type
Purchase Details
Closed on
Dec 12, 2022
Sold by
Brown Glenda V
Bought by
Cooper Sharon and Williams Family Irrevocale Trust Utd 12/
Current Estimated Value
Create a Home Valuation Report for This Property
The Home Valuation Report is an in-depth analysis detailing your home's value as well as a comparison with similar homes in the area
Home Values in the Area
Average Home Value in this Area
Purchase History
| Date | Buyer | Sale Price | Title Company |
|---|---|---|---|
| Cooper Sharon | -- | -- |
Source: Public Records
Tax History Compared to Growth
Tax History
| Year | Tax Paid | Tax Assessment Tax Assessment Total Assessment is a certain percentage of the fair market value that is determined by local assessors to be the total taxable value of land and additions on the property. | Land | Improvement |
|---|---|---|---|---|
| 2025 | $5,577 | $125,700 | $22,440 | $103,260 |
| 2024 | $5,577 | $107,040 | $22,440 | $84,600 |
| 2023 | $5,395 | $107,640 | $22,440 | $85,200 |
| 2022 | $1,480 | $103,740 | $22,440 | $81,300 |
| 2021 | $2,118 | $81,120 | $22,440 | $58,680 |
| 2020 | $2,118 | $94,800 | $22,440 | $72,360 |
| 2019 | $2,125 | $75,960 | $22,440 | $53,520 |
| 2018 | $4,405 | $24,841 | $5,491 | $19,350 |
| 2017 | $4,132 | $23,437 | $6,426 | $17,011 |
| 2016 | $1,590 | $22,123 | $8,192 | $13,931 |
| 2015 | $2,447 | $22,119 | $11,222 | $10,897 |
| 2014 | $2,447 | $21,920 | $13,338 | $8,582 |
Source: Public Records
Map
Nearby Homes
- 384 Hancock St
- 370 Hancock St Unit TWNHS
- 370 Hancock St
- 410 Hancock St
- 470 Jefferson Ave
- 318 Halsey St
- 344 Hancock St
- 251 Macon St
- 408 Madison St
- 259 Halsey St Unit 4R
- 259 Halsey St Unit 1R
- 259 Halsey St Unit 2R
- 259 Halsey St Unit 3F
- 259 Halsey St Unit 2F
- 231 Macon St
- 561 Putnam Ave
- 125 Macdonough St
- 435 Putnam Ave Unit TH
- 408 Monroe St
- 411 Monroe St Unit Multi-family 2 Units
- 385 Hancock St
- 381 Hancock St
- 381 Hancock St Unit 3
- 387 Hancock St
- 387 Hancock St Unit 1
- 387 Hancock St Unit 2
- 389 Hancock St
- 537 Throop Ave
- 535 Throop Ave
- 535 Throop Ave Unit 4
- 535 Throop Ave Unit 2
- 535 Throop Ave Unit 1
- 535 Throop Ave Unit 3
- 391 Hancock St
- 379 Hancock St
- 393 Hancock St
- 543 Throop Ave
- 428 Jefferson Ave
- 428 Jefferson Ave Unit 2