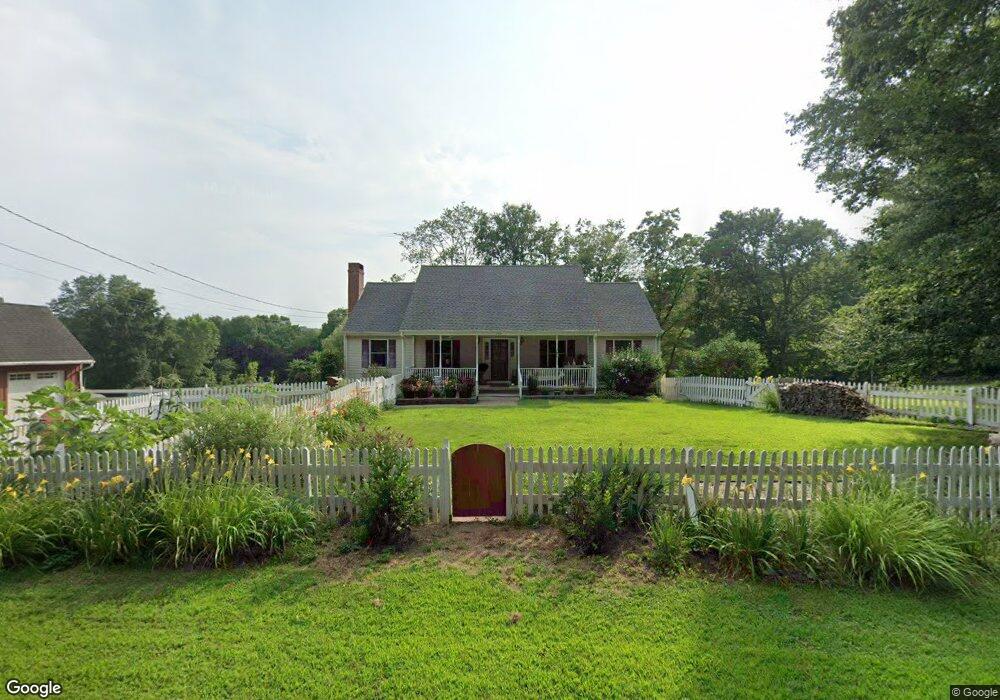
383 Hanover Rd Baltic, CT 06330
Estimated Value: $392,000 - $466,000
3
Beds
2
Baths
2,184
Sq Ft
$201/Sq Ft
Est. Value
About This Home
This home is located at 383 Hanover Rd, Baltic, CT 06330 and is currently estimated at $439,606, approximately $201 per square foot. 383 Hanover Rd is a home located in Windham County with nearby schools including Scotland Elementary School and Parish Hill High School.
Ownership History
Date
Name
Owned For
Owner Type
Purchase Details
Closed on
Apr 26, 2022
Sold by
Trahan Robert A and Trahan Deborah L
Bought by
Robert A Trahan Lt
Current Estimated Value
Purchase Details
Closed on
Mar 2, 2022
Sold by
Trahan Robert A and Trahan Deborah L
Bought by
Trahan Robert A and Trahan Deborah L
Purchase Details
Closed on
Oct 30, 2017
Sold by
Trahan Robert and Trahan Deborah
Bought by
Trahan Donald
Purchase Details
Closed on
May 23, 2012
Sold by
Trahan Robert A and Trahan Deborah L
Bought by
Robert A Trahan Ret and Trahan Deborah L
Purchase Details
Closed on
Sep 21, 2004
Sold by
Hewlitt Lawrence E and Hewlitt Paula J
Bought by
Trahan Robert A and Trahan Deborah L
Home Financials for this Owner
Home Financials are based on the most recent Mortgage that was taken out on this home.
Original Mortgage
$191,200
Interest Rate
6.02%
Create a Home Valuation Report for This Property
The Home Valuation Report is an in-depth analysis detailing your home's value as well as a comparison with similar homes in the area
Home Values in the Area
Average Home Value in this Area
Purchase History
| Date | Buyer | Sale Price | Title Company |
|---|---|---|---|
| Robert A Trahan Lt | -- | None Available | |
| Trahan Robert A | -- | None Available | |
| Trahan Donald | -- | -- | |
| Trahan Robert | -- | -- | |
| Robert A Trahan Ret | -- | -- | |
| Trahan Robert A | $249,900 | -- |
Source: Public Records
Mortgage History
| Date | Status | Borrower | Loan Amount |
|---|---|---|---|
| Previous Owner | Trahan Robert A | $191,200 | |
| Previous Owner | Trahan Robert A | $104,000 | |
| Previous Owner | Trahan Robert A | $90,000 |
Source: Public Records
Tax History
| Year | Tax Paid | Tax Assessment Tax Assessment Total Assessment is a certain percentage of the fair market value that is determined by local assessors to be the total taxable value of land and additions on the property. | Land | Improvement |
|---|---|---|---|---|
| 2025 | $8,638 | $274,820 | $28,140 | $246,680 |
| 2024 | $8,176 | $274,820 | $28,140 | $246,680 |
| 2023 | $8,668 | $216,700 | $28,200 | $188,500 |
| 2022 | $6,817 | $174,800 | $28,200 | $146,600 |
| 2021 | $6,817 | $174,800 | $28,200 | $146,600 |
| 2020 | $7,455 | $174,800 | $28,200 | $146,600 |
| 2019 | $7,455 | $174,800 | $28,200 | $146,600 |
| 2018 | $6,927 | $175,670 | $44,600 | $131,070 |
| 2017 | $6,795 | $175,670 | $44,600 | $131,070 |
| 2016 | $6,795 | $175,670 | $44,600 | $131,070 |
| 2015 | $6,280 | $175,670 | $44,600 | $131,070 |
| 2014 | $6,148 | $175,670 | $44,600 | $131,070 |
Source: Public Records
Map
Nearby Homes
- 0 Hanover Rd
- 8 Palmer Rd
- 7 Devotion Rd
- 0 Brook Rd Unit lot 4
- 63 Gay Head Rd
- 70 Crandall Ln
- 4.2 acres Potash Hill Rd
- 85 Potash Hill Rd
- 0 Salt Rock Rd
- 114 Scotland Rd
- 135 Scotland Rd
- 0 Brooklyn Rd Unit 24124218
- 3 Woodland Ln
- 165 Lisbon Rd
- 30 Noahs Way
- 181 Kimball Rd
- 19 Knollwood Dr
- 274 Colburn Rd
- 7 Franklin Rd
- 110 Pautipaug Hill Rd
- 393 Hanover Rd
- 364 Hanover Rd
- 355 Hanover Rd
- 408 Hanover Rd
- 356 Hanover Rd
- 347 Hanover Rd
- 331 Hanover Rd
- 424 Hanover Rd
- 318 Hanover Rd
- 323 Hanover Rd
- 448 Hanover Rd
- 306 Hanover Rd
- 354 Hanover Rd
- 317 Hanover Rd
- 454 Hanover Rd
- 300 Hanover Rd
- 233 Woodchuck Hill Rd
- 307 Hanover Rd
- 284 Hanover Rd
- 464 Hanover Rd
Your Personal Tour Guide
Ask me questions while you tour the home.