Estimated Value: $88,000 - $111,511
2
Beds
1
Bath
832
Sq Ft
$120/Sq Ft
Est. Value
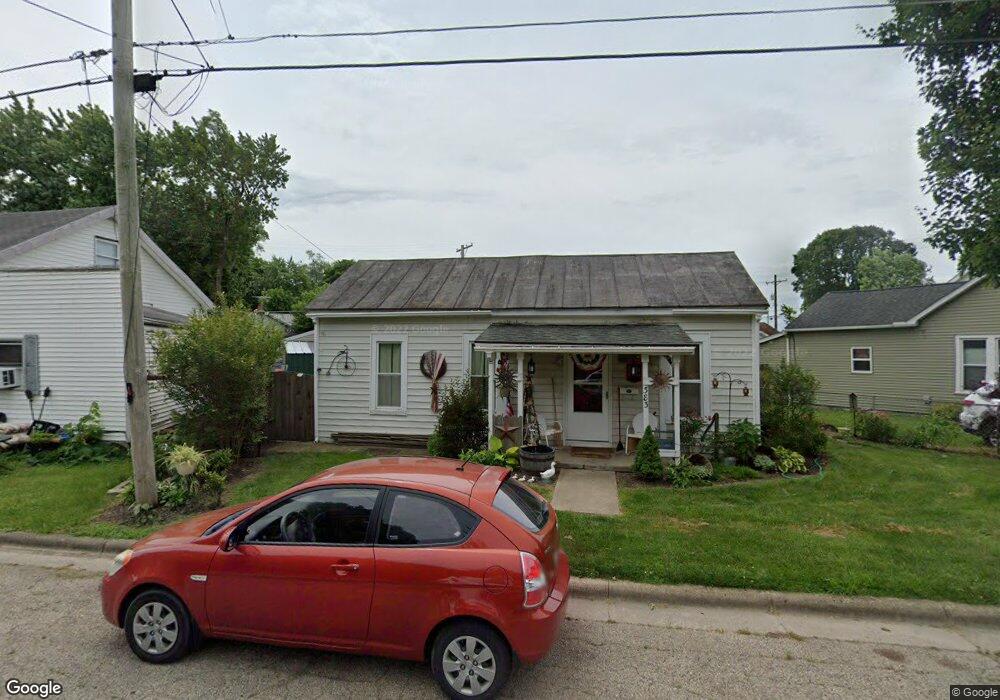
About This Home
This home is located at 383 Locust St, Xenia, OH 45385 and is currently estimated at $100,128, approximately $120 per square foot. 383 Locust St is a home located in Greene County with nearby schools including Xenia High School, Summit Academy Community School for Alternative Learners - Xenia, and Legacy Christian Academy.
Ownership History
Date
Name
Owned For
Owner Type
Purchase Details
Closed on
Oct 23, 2017
Sold by
Fleming James F and Fleming Amanda R
Bought by
Cano Valerie N
Current Estimated Value
Home Financials for this Owner
Home Financials are based on the most recent Mortgage that was taken out on this home.
Original Mortgage
$36,400
Outstanding Balance
$30,412
Interest Rate
3.83%
Mortgage Type
New Conventional
Estimated Equity
$69,716
Purchase Details
Closed on
Apr 2, 1999
Sold by
Rodney Laxley W and Rodney Hyacinthe
Bought by
Fleming James F and Fleming Amanda R
Home Financials for this Owner
Home Financials are based on the most recent Mortgage that was taken out on this home.
Original Mortgage
$38,000
Interest Rate
6.94%
Create a Home Valuation Report for This Property
The Home Valuation Report is an in-depth analysis detailing your home's value as well as a comparison with similar homes in the area
Home Values in the Area
Average Home Value in this Area
Purchase History
| Date | Buyer | Sale Price | Title Company |
|---|---|---|---|
| Cano Valerie N | $45,500 | -- | |
| Fleming James F | $38,000 | -- |
Source: Public Records
Mortgage History
| Date | Status | Borrower | Loan Amount |
|---|---|---|---|
| Open | Cano Valerie N | $36,400 | |
| Previous Owner | Fleming James F | $38,000 |
Source: Public Records
Tax History Compared to Growth
Tax History
| Year | Tax Paid | Tax Assessment Tax Assessment Total Assessment is a certain percentage of the fair market value that is determined by local assessors to be the total taxable value of land and additions on the property. | Land | Improvement |
|---|---|---|---|---|
| 2024 | $978 | $22,860 | $4,250 | $18,610 |
| 2023 | $978 | $22,860 | $4,250 | $18,610 |
| 2022 | $870 | $17,340 | $3,400 | $13,940 |
| 2021 | $882 | $17,340 | $3,400 | $13,940 |
| 2020 | $845 | $17,340 | $3,400 | $13,940 |
| 2019 | $758 | $14,640 | $3,580 | $11,060 |
| 2018 | $760 | $14,640 | $3,580 | $11,060 |
| 2017 | $713 | $14,640 | $3,580 | $11,060 |
| 2016 | $713 | $13,820 | $3,580 | $10,240 |
| 2015 | $715 | $13,820 | $3,580 | $10,240 |
| 2014 | $684 | $13,820 | $3,580 | $10,240 |
Source: Public Records
Map
Nearby Homes