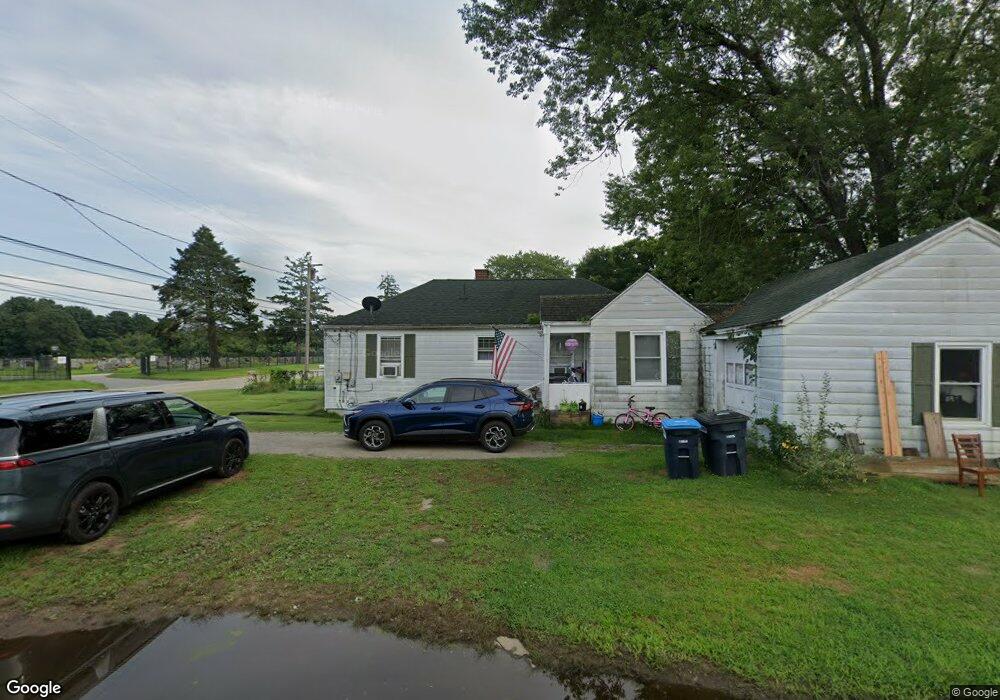
383 Maple St Danielson, CT 06239
Estimated Value: $278,025 - $308,000
3
Beds
1
Bath
1,144
Sq Ft
$260/Sq Ft
Est. Value
About This Home
This home is located at 383 Maple St, Danielson, CT 06239 and is currently estimated at $297,756, approximately $260 per square foot. 383 Maple St is a home located in Windham County with nearby schools including Killingly Central School, Killingly Memorial School, and Killingly Intermediate School.
Ownership History
Date
Name
Owned For
Owner Type
Purchase Details
Closed on
Nov 1, 2000
Sold by
Voorhees Lauretta
Bought by
Desjardin William D and Desjardin Cheryl A
Current Estimated Value
Home Financials for this Owner
Home Financials are based on the most recent Mortgage that was taken out on this home.
Original Mortgage
$60,000
Interest Rate
7.83%
Purchase Details
Closed on
Aug 6, 1996
Sold by
Goulet Annie Louise
Bought by
Carr George A and Voorhees Lauretta
Create a Home Valuation Report for This Property
The Home Valuation Report is an in-depth analysis detailing your home's value as well as a comparison with similar homes in the area
Home Values in the Area
Average Home Value in this Area
Purchase History
| Date | Buyer | Sale Price | Title Company |
|---|---|---|---|
| Desjardin William D | $95,000 | -- | |
| Desjardin William D | $95,000 | -- | |
| Carr George A | $60,000 | -- | |
| Carr George A | $60,000 | -- |
Source: Public Records
Mortgage History
| Date | Status | Borrower | Loan Amount |
|---|---|---|---|
| Closed | Carr George A | $64,000 | |
| Closed | Carr George A | $64,000 | |
| Closed | Carr George A | $60,000 |
Source: Public Records
Tax History
| Year | Tax Paid | Tax Assessment Tax Assessment Total Assessment is a certain percentage of the fair market value that is determined by local assessors to be the total taxable value of land and additions on the property. | Land | Improvement |
|---|---|---|---|---|
| 2025 | $3,707 | $147,980 | $26,630 | $121,350 |
| 2024 | $3,538 | $147,980 | $26,630 | $121,350 |
| 2023 | $3,259 | $101,570 | $21,910 | $79,660 |
| 2022 | $3,066 | $101,570 | $21,910 | $79,660 |
| 2021 | $3,066 | $101,570 | $21,910 | $79,660 |
| 2020 | $3,016 | $101,570 | $21,910 | $79,660 |
| 2019 | $3,048 | $101,570 | $21,910 | $79,660 |
| 2017 | $2,491 | $77,210 | $13,930 | $63,280 |
| 2016 | $2,491 | $77,210 | $13,930 | $63,280 |
| 2015 | $2,441 | $77,210 | $13,930 | $63,280 |
| 2014 | $2,383 | $77,210 | $13,930 | $63,280 |
Source: Public Records
Map
Nearby Homes
- 48 Athol St Unit 48
- 74 Athol St
- 144 Prospect Ave
- 133 Maple St
- 135 Adelaide St
- 37 Ruth St
- 10 Center St
- 24 Center St
- 37 Katherine Ave
- 102 Cottage St
- 85 Furnace St
- 73 Hawkins St
- 150 Broad St
- 35 S Main St
- 19 Plaza St
- 0 Providence Rd Unit 24080985
- 53 S Main St
- 18 Broad St
- 10 Cote Dr
- 0 Allen Hill Rd Unit 24140370
Your Personal Tour Guide
Ask me questions while you tour the home.