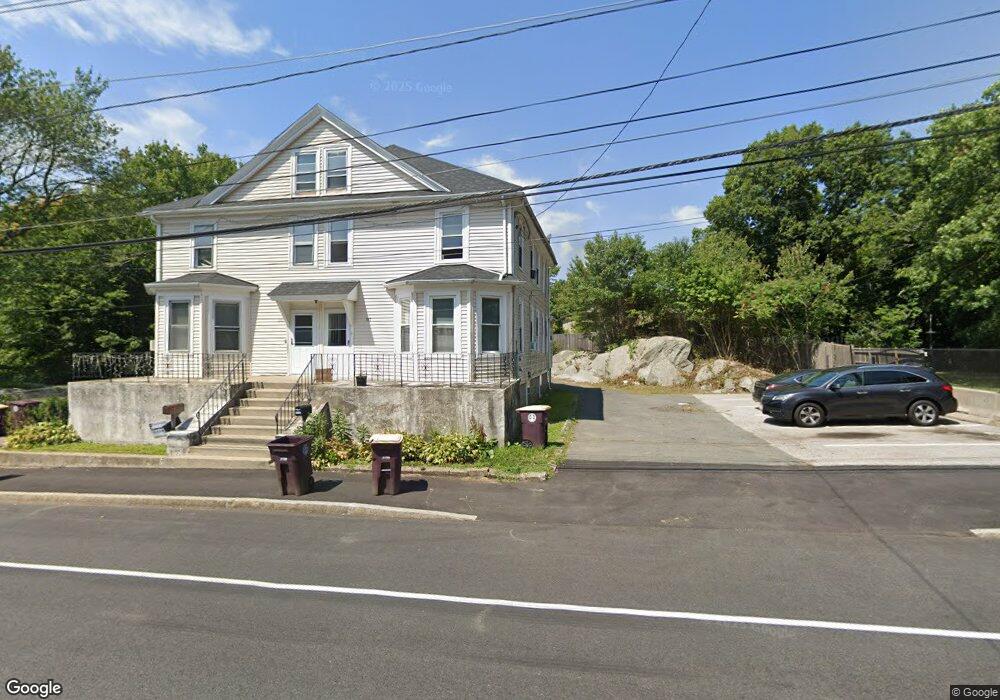
383 Middle St East Weymouth, MA 02189
East Weymouth NeighborhoodEstimated Value: $533,000 - $762,000
3
Beds
2
Baths
2,210
Sq Ft
$287/Sq Ft
Est. Value
About This Home
This home is located at 383 Middle St, East Weymouth, MA 02189 and is currently estimated at $634,864, approximately $287 per square foot. 383 Middle St is a home located in Norfolk County with nearby schools including Abigail Adams Middle School, William Seach Elementary School, and Weymouth Middle School Chapman.
Ownership History
Date
Name
Owned For
Owner Type
Purchase Details
Closed on
Feb 15, 2019
Sold by
Melchione Joseph L
Bought by
Melchione Joseph L and Melchione Lauretta
Current Estimated Value
Purchase Details
Closed on
Mar 3, 2009
Sold by
Fnma
Bought by
385 Middle Street Llc
Purchase Details
Closed on
Feb 15, 2008
Sold by
Zeoli John
Bought by
Federal National Mortgage Association
Purchase Details
Closed on
Apr 6, 2005
Sold by
Zeoli John
Bought by
John Zeoli Revocable L
Create a Home Valuation Report for This Property
The Home Valuation Report is an in-depth analysis detailing your home's value as well as a comparison with similar homes in the area
Home Values in the Area
Average Home Value in this Area
Purchase History
| Date | Buyer | Sale Price | Title Company |
|---|---|---|---|
| Melchione Joseph L | -- | -- | |
| 385 Middle Street Llc | $138,000 | -- | |
| Federal National Mortgage Association | $291,789 | -- | |
| John Zeoli Revocable L | -- | -- |
Source: Public Records
Tax History Compared to Growth
Tax History
| Year | Tax Paid | Tax Assessment Tax Assessment Total Assessment is a certain percentage of the fair market value that is determined by local assessors to be the total taxable value of land and additions on the property. | Land | Improvement |
|---|---|---|---|---|
| 2025 | $4,805 | $475,700 | $205,000 | $270,700 |
| 2024 | $4,653 | $453,100 | $195,300 | $257,800 |
| 2023 | $4,485 | $429,200 | $180,800 | $248,400 |
| 2022 | $4,374 | $381,700 | $167,400 | $214,300 |
| 2021 | $4,178 | $355,900 | $167,400 | $188,500 |
| 2020 | $4,041 | $339,000 | $167,400 | $171,600 |
| 2019 | $3,943 | $325,300 | $161,000 | $164,300 |
| 2018 | $3,819 | $305,500 | $153,300 | $152,200 |
| 2017 | $3,855 | $300,900 | $146,000 | $154,900 |
| 2016 | $3,704 | $289,400 | $140,400 | $149,000 |
| 2015 | $3,568 | $276,600 | $140,400 | $136,200 |
| 2014 | $3,422 | $257,300 | $130,700 | $126,600 |
Source: Public Records
Map
Nearby Homes
- 449 Middle St
- 303 Middle St
- 42 Sundin Rd
- 209 Lake St Unit 69
- 211 Lake Shore Dr
- 575 Broad St Unit 305
- 575 Broad St Unit 215
- 286 Essex St
- 12 Klasson Ln
- 286 Broad St
- 367 Essex St
- 215 Winter St Unit 1P
- 145 Jaffrey St
- 966 Washington St Unit 2
- 16 Oak Cliff Rd
- 747 Middle St
- 56 Putnam St
- 25 Echo Ave
- 1015 Washington St
- 33 Congress St