Estimated Value: $247,000 - $283,000
--
Bed
--
Bath
1,445
Sq Ft
$180/Sq Ft
Est. Value
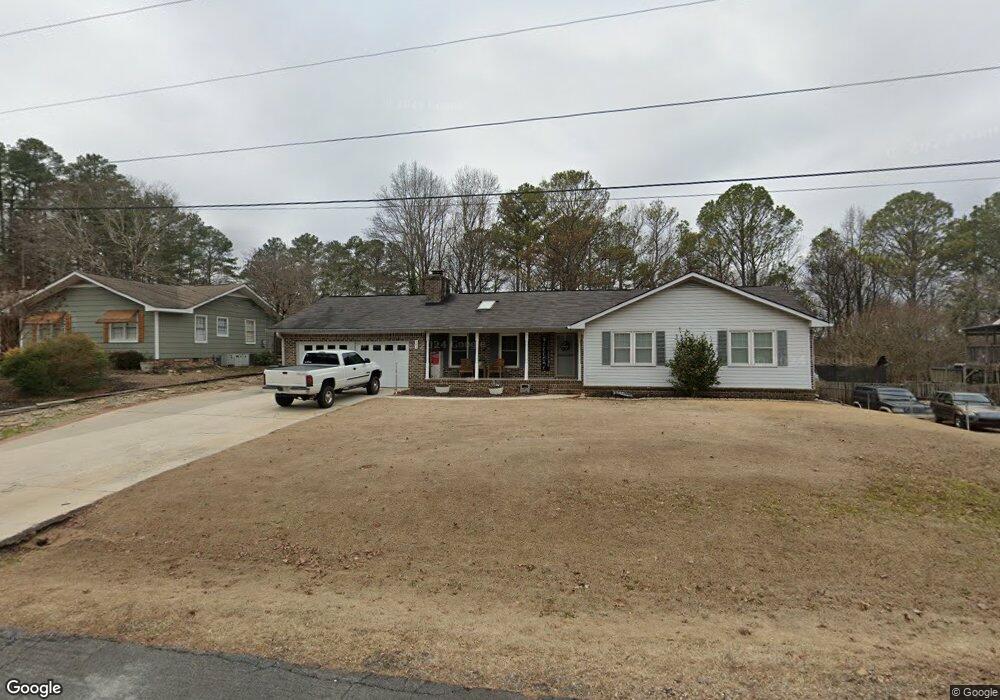
About This Home
This home is located at 383 Mountain View Rd SE, Rome, GA 30161 and is currently estimated at $259,946, approximately $179 per square foot. 383 Mountain View Rd SE is a home located in Floyd County with nearby schools including Pepperell Middle School, Pepperell High School, and Montessori School of Rome.
Ownership History
Date
Name
Owned For
Owner Type
Purchase Details
Closed on
Nov 8, 2019
Sold by
Barrett Linda J
Bought by
Paige Brian A and Paige Alisha D
Current Estimated Value
Purchase Details
Closed on
Nov 22, 2017
Sold by
Young Randell L
Bought by
Paige Alisha D and Paige Michael T
Home Financials for this Owner
Home Financials are based on the most recent Mortgage that was taken out on this home.
Original Mortgage
$139,918
Interest Rate
4.5%
Mortgage Type
FHA
Purchase Details
Closed on
Jul 13, 1990
Sold by
Thomas John David
Bought by
Young Randell L and Young Sarah
Purchase Details
Closed on
Apr 27, 1973
Sold by
Builders Realty & Dev Co
Bought by
Thomas John David
Purchase Details
Closed on
Dec 26, 1972
Sold by
Rod Dempsey Properties Inc
Bought by
Builders Realty & Dev Co
Purchase Details
Closed on
Jan 1, 1901
Bought by
Miller Arhtur S and Miller Es
Create a Home Valuation Report for This Property
The Home Valuation Report is an in-depth analysis detailing your home's value as well as a comparison with similar homes in the area
Home Values in the Area
Average Home Value in this Area
Purchase History
| Date | Buyer | Sale Price | Title Company |
|---|---|---|---|
| Paige Brian A | $500 | -- | |
| Paige Alisha D | $142,500 | -- | |
| Young Randell L | $74,500 | -- | |
| Thomas John David | $34,800 | -- | |
| Builders Realty & Dev Co | $2,500 | -- | |
| Rod Dempsey Properties Inc | -- | -- | |
| Miller Arhtur S | -- | -- |
Source: Public Records
Mortgage History
| Date | Status | Borrower | Loan Amount |
|---|---|---|---|
| Previous Owner | Paige Alisha D | $139,918 |
Source: Public Records
Tax History Compared to Growth
Tax History
| Year | Tax Paid | Tax Assessment Tax Assessment Total Assessment is a certain percentage of the fair market value that is determined by local assessors to be the total taxable value of land and additions on the property. | Land | Improvement |
|---|---|---|---|---|
| 2024 | $3,104 | $101,739 | $5,600 | $96,139 |
| 2023 | $2,911 | $98,432 | $4,800 | $93,632 |
| 2022 | $2,193 | $73,916 | $4,000 | $69,916 |
| 2021 | $1,961 | $64,968 | $4,000 | $60,968 |
| 2020 | $1,892 | $62,175 | $3,200 | $58,975 |
| 2019 | $1,805 | $60,106 | $3,200 | $56,906 |
| 2018 | $1,715 | $57,960 | $3,200 | $54,760 |
| 2017 | $1,105 | $36,666 | $3,200 | $33,466 |
| 2016 | $1,115 | $36,539 | $3,200 | $33,339 |
| 2015 | $1,090 | $36,539 | $3,200 | $33,339 |
| 2014 | $1,090 | $36,539 | $3,200 | $33,339 |
Source: Public Records
Map
Nearby Homes
- 263 Mountain View Rd SE
- 452 Mountain View Rd SE
- 3038 Callier Springs Rd SE
- 3028 Callier Springs Rd SE
- 145 Mountain View Rd SE
- 3018 Callier Springs Rd SE
- 95 Dodd Blvd SE
- 93 Dodd Blvd SE
- 94 Dodd Blvd SE
- 94 A&B Dodd Blvd
- 74 Dodd Blvd SE
- 119 Chateau Dr SE
- 113 Chateau Dr SE
- 1 Joe Louis Blvd SE
- 20 Coventry Dr SE
- 22 Coventry Dr SE
- 35 Cumberland Dr SE
- 3 Jewell Dr SE Unit 22
- 5 Jewell Dr SE
- 2107 Rockmart Rd SE
- 373 Mountain View Rd SE
- 373 Mountain View Rd SE
- 373 Mountain View Rd SE
- 373 Mountain View Rd SE
- 373 Mountain View Rd SE
- 373 Mountain View Rd SE
- 373 Mountain View Rd SE
- 393 Mountain View Rd SE
- 3 Lakeview St SW
- 403 Mountain View Rd SE
- 361 Mountain View Rd SE
- 390 Mountain View Rd SE
- 402 Mountain View Rd SE
- 413 Mountain View Rd SE
- 414 Mountain View Rd SE
- 423 Mountain View Rd SE
- 0 Mountain View Dr SE Unit 3242433
- 0 Mountain View Dr SE Unit 8071559
- 424 Mountain View Rd SE
- 424 Mountain View Rd SE